0%
Polygon’s RSI Hints at Bullish Divergence
#crypto trading tips#technical indicators#Relative Strength Index+2 mais tags

Polygon’s RSI Hints at Bullish Divergence

Polygon (MATIC) has printed a bullish divergence signal on the daily chart, which helped the cryptocurrency appreciate by 65%. The RSI bullish divergence is a classic signal that hints at a possible change in the MATIC price from bearish to bullish.

Throughout this analysis, we're going to examine whether the current rally has more legs to the upside or this is just a short-lived rally.

Polygon (MATIC) bullish divergence

RSI Bullish Divergence

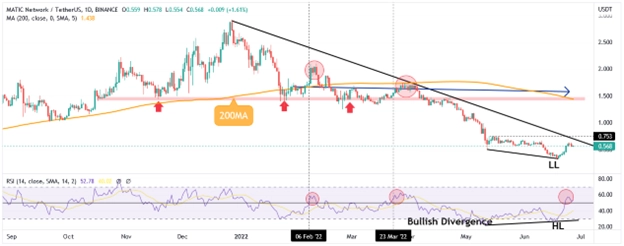
The Relative Strength Index (RSI) bullish divergence forms when the MATIC price makes lower lows while at the same time the momentum oscillator makes a higher low.

This is often considered a buy signal. However, the overall price structure still looks bearish. From a technical point of view, two things are working against the bulls:

  1. The price is still trading well below the 200-day Simple Moving Average (SMA), which hints at a bearish trend.

  2. MATIC's price still trades below the descending trendline drawn from the previous all-time high.

  3. While the RSI broke above the 50 mid-level the previous two times, it displayed the same pattern; MATIC's price reversed back down as the bullish momentum dried out.

What is a RSI Bullish Divergence?

A bullish divergence is a technical pattern in which the price of an asset makes lower lows, while the momentum oscillator makes a higher low.

The RSI bullish divergence usually forms at the end of a downtrend. The more consecutive lower lows the price makes, the more bullish the divergence becomes.

The bullish divergence is considered a strong reversal pattern, as it shows that the selling pressure has dried out and the bulls are starting to gain control over the market.

200-Day Moving Average

When the 200-day Simple Moving Average turns flat, that is often a sign of more consolidation ahead. Some key levels to consider for a possible range action are the $0.75 short-term resistance level and the previous swing low of $0.31.

Looking forward

The RSI bullish divergence hinted at a possible change in trend for the MATIC price. However, the bearish price structure still dominates the longer-term outlook.

If the price were to break above the descending trendline and reclaim the 200-day simple moving average, that would be considered a strong bullish sign.

Imagem da caixa de entrada

Informativo

Receba o e-mail semanal com análises exclusivas de critomoedas e notícias que valem a pena ler. Mantenha-se informado e entretido, de graça.

Automatize
seus
tradings!

Bot de trading de criptomoedas automatizado de nível mundial

Vamos começar
Automatize suas operações

Artigos relacionados

Bot Trading 101 | How To Apply a Scalping Strategy
#Automated trading strategy#Strategy designer#EMA+3 mais tags

Bot Trading 101 | How To Apply a Scalping Strategy

Cryptocurrencies | BTC vs. USDT As Quote Currency
#Bitcoin#crypto trading#crypto trading tips+2 mais tags

Cryptocurrencies | BTC vs. USDT As Quote Currency

Technical Analysis 101 | What Are the 4 Types of Indicators?

Technical Analysis 101 | What Are the 4 Types of Indicators?

Bot Trading 101 | The 9 Best Trading Bot Tips of 2023
#crypto trading#trading bot#crypto trading tips+2 mais tags

Bot Trading 101 | The 9 Best Trading Bot Tips of 2023

Comece a operar com o Cryptohopper gratuitamente!

Uso gratuito - não é necessário cartão de crédito

Vamos começar
Cryptohopper appCryptohopper app

Aviso Legal: O Cryptohopper não é uma entidade regulamentada. A operação de bots de criptomoeda envolve riscos substanciais, e o desempenho passado não é indicativo de resultados futuros. Os lucros mostrados nas capturas de tela do produto são para fins ilustrativos e podem ser exagerados. Somente se envolva na operações de bots se você possuir conhecimento suficiente ou procurar orientação de um consultor financeiro qualificado. Em nenhuma circunstância, o Cryptohopper aceitará qualquer responsabilidade perante qualquer pessoa ou entidade por (a) qualquer perda ou dano, no todo ou em parte, causado por, decorrente de ou em conexão com transações envolvendo nosso software ou (b) quaisquer danos diretos, indiretos, especiais, consequenciais ou incidentais. Por favor, observe que o conteúdo disponível na plataforma de social trading do Cryptohopper é gerado por membros da comunidade Cryptohopper e não constitui aconselhamento ou recomendações do Cryptohopper ou em seu nome. Os lucros mostrados no Marketplace não são indicativos de resultados futuros. Ao usar os serviços do Cryptohopper, você reconhece e aceita os riscos inerentes envolvidos na operação de criptomoedas e concorda em isentar o Cryptohopper de quaisquer responsabilidades ou perdas incorridas. É essencial revisar e compreender nossos Termos de Serviço e Política de Divulgação de Risco antes de usar nosso software ou se envolver em qualquer atividade de operação. Consulte profissionais da área jurídica e financeira para obter orientação personalizada com base em suas circunstâncias específicas.

©2017 - 2024 Copyright by Cryptohopper™ - Todos os direitos reservados.