0%
Polygon’s RSI Hints at Bullish Divergence
#crypto trading tips#technical indicators#Relative Strength Index+2 meer tags

Polygon’s RSI Hints at Bullish Divergence

Polygon (MATIC) has printed a bullish divergence signal on the daily chart, which helped the cryptocurrency appreciate by 65%. The RSI bullish divergence is a classic signal that hints at a possible change in the MATIC price from bearish to bullish.

Throughout this analysis, we're going to examine whether the current rally has more legs to the upside or this is just a short-lived rally.
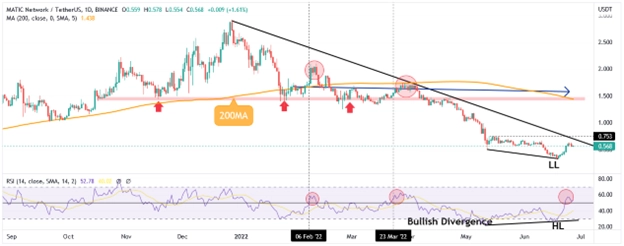
Polygon (MATIC) bullish divergence

RSI Bullish Divergence

The Relative Strength Index (RSI) bullish divergence forms when the MATIC price makes lower lows while at the same time the momentum oscillator makes a higher low.

This is often considered a buy signal. However, the overall price structure still looks bearish. From a technical point of view, two things are working against the bulls:

  1. The price is still trading well below the 200-day Simple Moving Average (SMA), which hints at a bearish trend.

  2. MATIC's price still trades below the descending trendline drawn from the previous all-time high.

  3. While the RSI broke above the 50 mid-level the previous two times, it displayed the same pattern; MATIC's price reversed back down as the bullish momentum dried out.

What is a RSI Bullish Divergence?

A bullish divergence is a technical pattern in which the price of an asset makes lower lows, while the momentum oscillator makes a higher low.

The RSI bullish divergence usually forms at the end of a downtrend. The more consecutive lower lows the price makes, the more bullish the divergence becomes.

The bullish divergence is considered a strong reversal pattern, as it shows that the selling pressure has dried out and the bulls are starting to gain control over the market.

200-Day Moving Average

When the 200-day Simple Moving Average turns flat, that is often a sign of more consolidation ahead. Some key levels to consider for a possible range action are the $0.75 short-term resistance level and the previous swing low of $0.31.

Looking forward

The RSI bullish divergence hinted at a possible change in trend for the MATIC price. However, the bearish price structure still dominates the longer-term outlook.

If the price were to break above the descending trendline and reclaim the 200-day simple moving average, that would be considered a strong bullish sign.

Inbox afbeelding

Nieuwsbrief

Krijg wekelijks een e-mail met exclusieve crypto-analyses en nieuws dat de moeite waard is om te lezen. Blijf op de hoogte, helemaal gratis.

Automatiseer
je
trading!

Geautomatiseerde crypto trading bot van wereldklasse

Laten we beginnen
Automatiseer je handel

Verwante artikelen

Bot Trading 101 | How To Apply a Scalping Strategy
#Automated trading strategy#Strategy designer#EMA+3 meer tags

Bot Trading 101 | How To Apply a Scalping Strategy

Cryptocurrencies | BTC vs. USDT As Quote Currency
#Bitcoin#crypto trading#crypto trading tips+2 meer tags

Cryptocurrencies | BTC vs. USDT As Quote Currency

Technical Analysis 101 | What Are the 4 Types of Trading Indicators?

Technical Analysis 101 | What Are the 4 Types of Trading Indicators?

Bot Trading 101 | The 9 Best Trading Bot Tips of 2023
#crypto trading#trading bot#crypto trading tips+2 meer tags

Bot Trading 101 | The 9 Best Trading Bot Tips of 2023

Begin gratis te handelen met Cryptohopper!

Gratis te gebruiken - geen creditcard nodig

Laten we beginnen
Cryptohopper appCryptohopper app

Disclaimer: Cryptohopper is geen gereguleerde entiteit. De handel in cryptocurrency bots brengt aanzienlijke risico's met zich mee en in het verleden behaalde resultaten bieden geen garantie voor de toekomst. De winsten getoond in product screenshots zijn voor illustratieve doeleinden en kunnen overdreven zijn. Doe alleen aan bothandel als u over voldoende kennis beschikt of vraag advies aan een gekwalificeerd financieel adviseur. In geen geval aanvaardt Cryptohopper enige aansprakelijkheid jegens enige persoon of entiteit voor (a) enig verlies of schade, geheel of gedeeltelijk, veroorzaakt door, voortvloeiend uit of in verband met transacties met onze software of (b) enige directe, indirecte, speciale, gevolg- of incidentele schade. Houd er rekening mee dat de inhoud die beschikbaar is op het Cryptohopper sociale handelsplatform is gegenereerd door leden van de Cryptohopper gemeenschap en geen advies of aanbevelingen van Cryptohopper of namens haar vormt. Winsten getoond op de Marktplaats zijn niet indicatief voor toekomstige resultaten. Door gebruik te maken van de diensten van Cryptohopper, erkent en aanvaardt u de inherente risico's die betrokken zijn bij de handel in cryptocurrency en gaat u ermee akkoord Cryptohopper te vrijwaren van eventuele aansprakelijkheden of opgelopen verliezen. Het is essentieel om onze Servicevoorwaarden en Risicobeleid te lezen en te begrijpen voordat u onze software gebruikt of deelneemt aan handelsactiviteiten. Raadpleeg juridische en financiële professionals voor persoonlijk advies op basis van uw specifieke omstandigheden.

©2017 - 2024 Copyright door Cryptohopper™ - Alle rechten voorbehouden.