0%
Is Huobi Token Megaphone Pattern Bullish or Bearish?
#Charts#support and resistance#Relative Strength Index+2 más etiquetas

Is Huobi Token Megaphone Pattern Bullish or Bearish?

Over the past 3.5 months, Huobi Token (HT) has been developing a megaphone pattern, also known as the broadening pattern. The pattern is neither bullish nor bearish, but it hints at a period of heightened volatility as long as HT's price remains trapped inside the megaphone support and resistance levels.

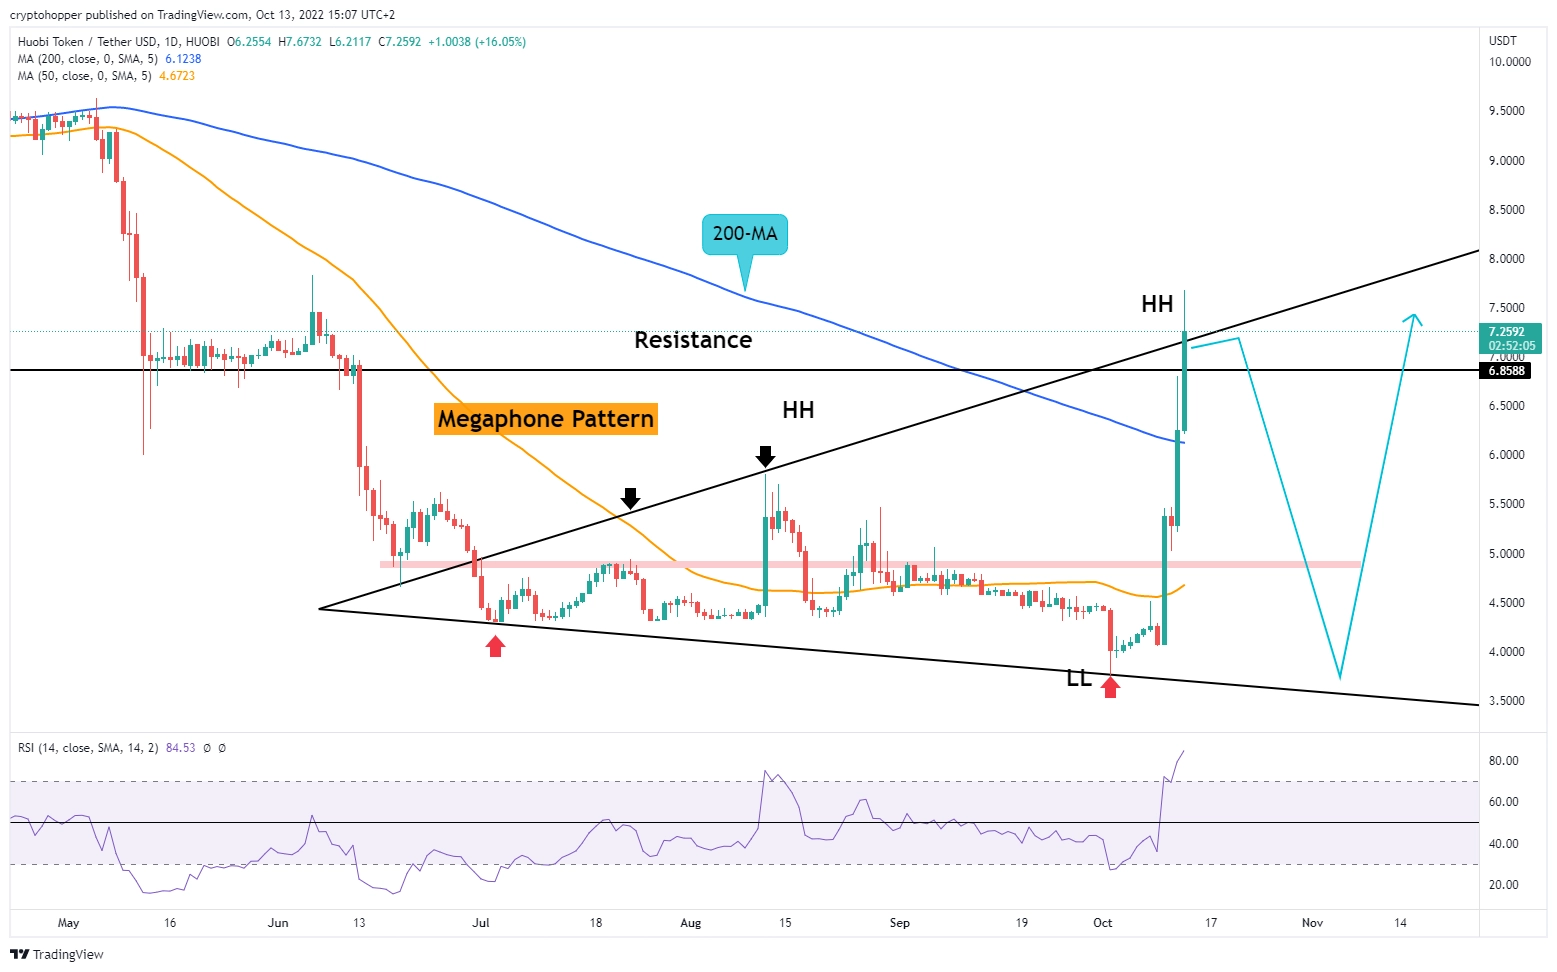
HT Megaphone Pattern

The megaphone pattern can be recognized by successive higher highs and lower lows. On the price chart, this pattern is visible by two diverging trendlines. Usually, the pattern marks a period of high volatility with no clear market direction.

HT's price is testing the upper resistance trendline of the megaphone pattern around the $7.10 level.

HT Huobi megaphone pattern

What is the Megaphone Pattern?

The Megaphone Pattern is a technical analysis charting pattern that is used to predict bullish or bearish price movements.

The pattern is created by drawing a trendline between two high points and two low points, and then extending the trendlines outwards.

The resulting shape resembles a megaphone, hence the name. The Megaphone Pattern is considered to be a bullish signal when it forms during an uptrend, and a bearish signal when it forms during a downtrend.

The theory behind the pattern is that it takes increasing amounts of buying (or selling) pressure to move the price from the lows to the highs, and vice versa. Therefore, when the price creates new highs and lows outside of the trendline boundaries, it is seen as a sign of increasing momentum in that direction.

RSI Oscillator

After the recent sharp rally, HT's price is greatly overbought. The Relative Strength Index (RSI) has reached its highest reading of 84 since February 2021.

Fears of the rally losing momentum are justified, as other technical factors are calling for a pause.

Aside from being at extreme overbought levels, HT's price is also battling the key 200-day simple moving average.

200-Day Simple Moving Average

While we broke above the 200-day simple moving average, it remains to be seen how this plays out within the megaphone pattern.

For a fundamental shift in the market sentiment, we need multiple daily closes above the 200-day SMA.

The current daily candle already shows signs of rejection at the megaphone resistance trendline, which may be another sign that, in the short term, the bullish momentum is running out of steam.

Looking forward: To the downside, the first support area is the $5.00 big psychological level. A daily break and close below $5.00 will eventually open the door for a retest of the lower support trendline.

Imagen de la bandeja de entrada

Boletín

Recibe el correo electrónico semanal con análisis de crypto exclusivos noticias que vale la pena leer. Mantente informado y entretenido, gratis.

Automatiza
tus
operaciones.

Bot automatizado de clase mundial para el Trading de criptomonedas

Comencemos
Automatiza tus operaciones

Artículos relacionados

Bot Trading 101 | How To Apply a Scalping Strategy
#Automated trading strategy#Strategy designer#EMA+3 más etiquetas

Bot Trading 101 | How To Apply a Scalping Strategy

Cryptocurrencies | BTC vs. USDT As Quote Currency
#Bitcoin#crypto trading#crypto trading tips+2 más etiquetas

Cryptocurrencies | BTC vs. USDT As Quote Currency

Technical Analysis 101 | What Are the 4 Types of Indicators?

Technical Analysis 101 | What Are the 4 Types of Indicators?

Bot Trading 101 | The 9 Best Trading Bot Tips of 2023
#crypto trading#trading bot#crypto trading tips+2 más etiquetas

Bot Trading 101 | The 9 Best Trading Bot Tips of 2023

¡Comienza a operar gratis con Cryptohopper!

Uso gratuito, sin tarjeta de crédito.

Comencemos
Cryptohopper appCryptohopper app

Descargo de responsabilidad: Cryptohopper no es una entidad regulada. El Trading de bots de criptomoneda implica riesgos sustanciales, y el rendimiento pasado no es indicativo de resultados futuros. Las ganancias mostrados en las capturas de pantalla de los productos tienen fines ilustrativos y pueden ser exagerados. Participe en el Trading con bots únicamente si posee conocimientos suficientes o busque la orientación de un asesor financiero cualificado. Bajo ninguna circunstancia Cryptohopper aceptará responsabilidad alguna ante ninguna persona o entidad por (a) cualquier pérdida o daño, total o parcial, causado por, derivado de o en relación con transacciones que impliquen nuestro software o (b) cualquier daño directo, indirecto, especial, consecuente o incidental. Tenga en cuenta que el contenido disponible en la plataforma de Trading social Cryptohopper es generado por los miembros de la comunidad Cryptohopper y no constituye asesoramiento o recomendaciones de Cryptohopper o en su nombre. Las ganancias mostrados en el Marketplace no son indicativos de resultados futuros. Al utilizar los servicios de Cryptohopper, usted reconoce y acepta los riesgos inherentes al Trading de criptomonedas y se compromete a eximir a Cryptohopper de cualquier responsabilidad o pérdida en que incurra. Es esencial revisar y comprender nuestras Condiciones de servicio y Política de divulgación de riesgos antes de utilizar nuestro software o participar en cualquier actividad comercial. Consulte a profesionales jurídicos y financieros para obtener asesoramiento personalizado en función de sus circunstancias específicas.

©2017 - 2024 Copyright por Cryptohopper™ - Todos los derechos reservados.