0%
Is Huobi Token Megaphone Pattern Bullish or Bearish?
#Charts#support and resistance#Relative Strength Index+2 więcej tagów

Is Huobi Token Megaphone Pattern Bullish or Bearish?

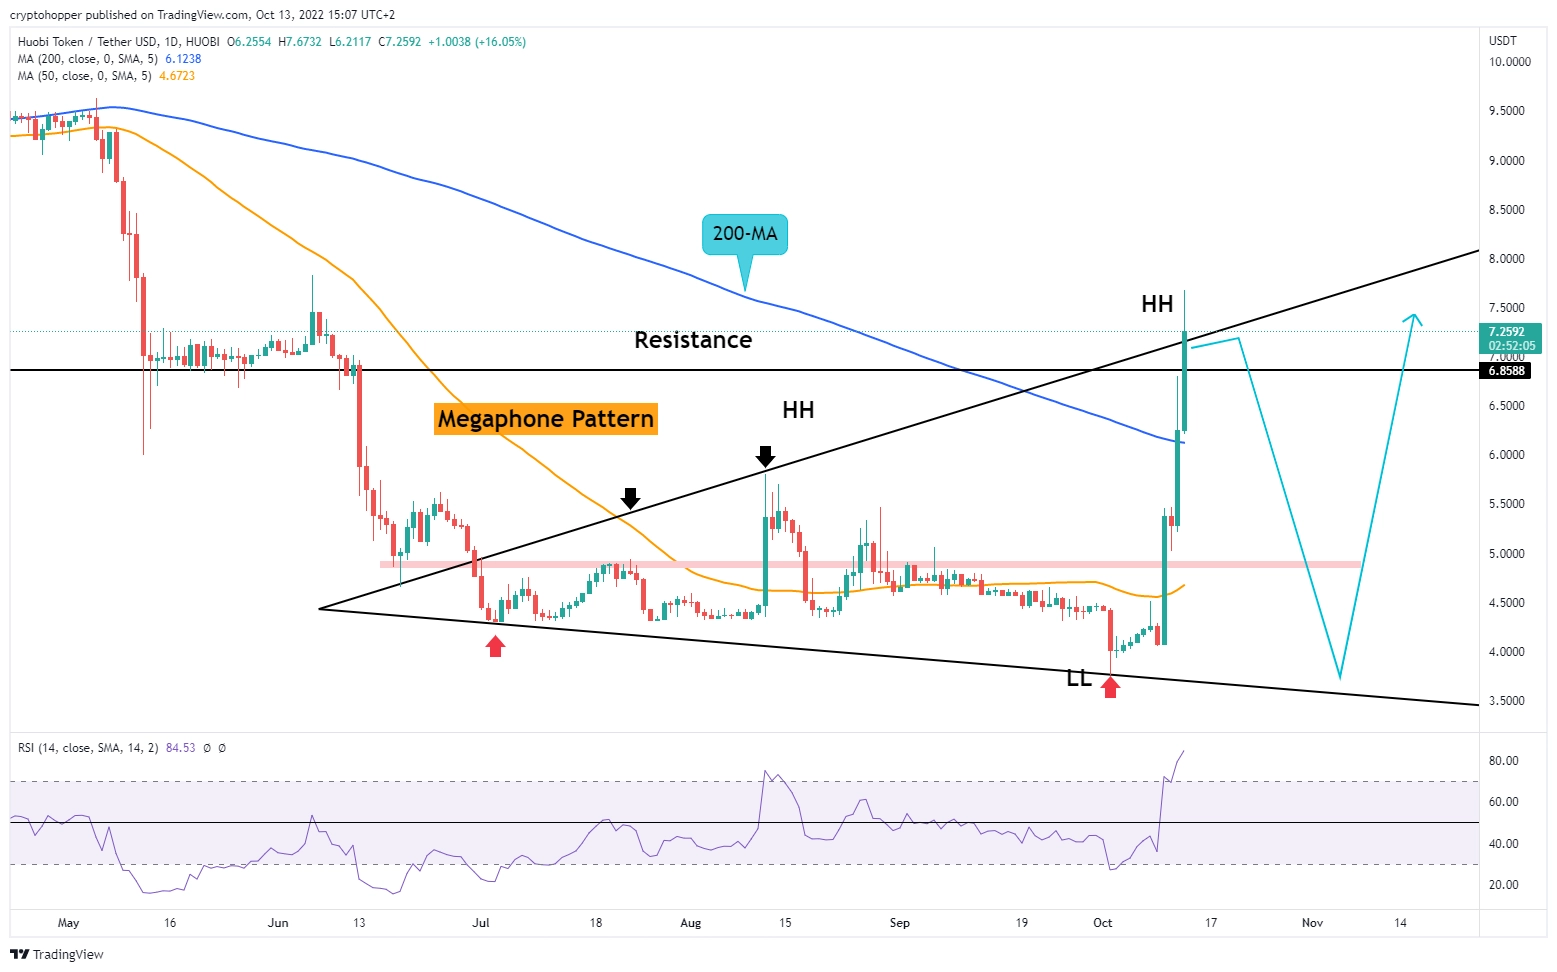
Over the past 3.5 months, Huobi Token (HT) has been developing a megaphone pattern, also known as the broadening pattern. The pattern is neither bullish nor bearish, but it hints at a period of heightened volatility as long as HT's price remains trapped inside the megaphone support and resistance levels.

HT Megaphone Pattern

The megaphone pattern can be recognized by successive higher highs and lower lows. On the price chart, this pattern is visible by two diverging trendlines. Usually, the pattern marks a period of high volatility with no clear market direction.

HT's price is testing the upper resistance trendline of the megaphone pattern around the $7.10 level.
HT Huobi megaphone pattern

What is the Megaphone Pattern?

The Megaphone Pattern is a technical analysis charting pattern that is used to predict bullish or bearish price movements.

The pattern is created by drawing a trendline between two high points and two low points, and then extending the trendlines outwards.

The resulting shape resembles a megaphone, hence the name. The Megaphone Pattern is considered to be a bullish signal when it forms during an uptrend, and a bearish signal when it forms during a downtrend.

The theory behind the pattern is that it takes increasing amounts of buying (or selling) pressure to move the price from the lows to the highs, and vice versa. Therefore, when the price creates new highs and lows outside of the trendline boundaries, it is seen as a sign of increasing momentum in that direction.

RSI Oscillator

After the recent sharp rally, HT's price is greatly overbought. The Relative Strength Index (RSI) has reached its highest reading of 84 since February 2021.

Fears of the rally losing momentum are justified, as other technical factors are calling for a pause.

Aside from being at extreme overbought levels, HT's price is also battling the key 200-day simple moving average.

200-Day Simple Moving Average

While we broke above the 200-day simple moving average, it remains to be seen how this plays out within the megaphone pattern.

For a fundamental shift in the market sentiment, we need multiple daily closes above the 200-day SMA.

The current daily candle already shows signs of rejection at the megaphone resistance trendline, which may be another sign that, in the short term, the bullish momentum is running out of steam.

Looking forward: To the downside, the first support area is the $5.00 big psychological level. A daily break and close below $5.00 will eventually open the door for a retest of the lower support trendline.

Obraz skrzynki odbiorczej

Newsletter

Zaprenumeruj cotygodniowy newsletter z wyjątkowymi analizami kryptowalut i wiadomościami, które warto znać. Bądź na bieżąco i baw się dobrze, za darmo.

Zautomatyzuj
Twój
handel!

Światowej klasy automatyczny bot do handlu kryptowalutami

Zaczynajmy
Automatyzacja handlu

Powiązane artykuły

Bot Trading 101 | How To Apply a Scalping Strategy
#Automated trading strategy#Strategy designer#EMA+3 więcej tagów

Bot Trading 101 | How To Apply a Scalping Strategy

Cryptocurrencies | BTC vs. USDT As Quote Currency
#Bitcoin#crypto trading#crypto trading tips+2 więcej tagów

Cryptocurrencies | BTC vs. USDT As Quote Currency

Technical Analysis 101 | What Are the 4 Types of Indicators?

Technical Analysis 101 | What Are the 4 Types of Indicators?

Bot Trading 101 | The 9 Best Trading Bot Tips of 2023
#crypto trading#trading bot#crypto trading tips+2 więcej tagów

Bot Trading 101 | The 9 Best Trading Bot Tips of 2023

Rozpocznij darmowy handel z Cryptohopperem!

Bezpłatne użytkowanie - karta kredytowa nie jest wymagana

Zaczynajmy
Cryptohopper appCryptohopper app

Informacja: Cryptohopper nie jest regulowanym podmiotem. Handel kryptowalutami za pomocą botów wiąże się z dużym ryzykiem, a wcześniejsze wyniki nie gwarantują przyszłych rezultatów. Prezentowane zyski na zrzutach ekranu produktu mają charakter ilustracyjny i mogą być zawyżone. Podejmuj handel botami tylko wtedy, gdy posiadasz odpowiednią wiedzę lub skonsultuj się z wykwalifikowanym doradcą finansowym. Cryptohopper nie ponosi odpowiedzialności za (a) jakiekolwiek straty lub szkody, całkowite lub częściowe, wynikające z transakcji z wykorzystaniem naszego oprogramowania lub (b) jakiekolwiek szkody bezpośrednie, pośrednie, specjalne, wynikowe lub przypadkowe. Pamiętaj, że treści dostępne na platformie handlu społecznościowego Cryptohopper są tworzone przez członków społeczności Cryptohopper i nie stanowią porad lub zaleceń ze strony Cryptohopper. Zyski prezentowane na Rynku nie są gwarancją przyszłych wyników. Korzystając z usług Cryptohopper, akceptujesz ryzyko związane z handlem kryptowalutami i zobowiązujesz się do niepociągania Cryptohopper do odpowiedzialności za ewentualne straty. Przed korzystaniem z naszego oprogramowania lub podjęciem jakiejkolwiek działalności handlowej, konieczne jest zapoznanie się z naszymi Warunkami świadczenia usług i oświadczenie dot. ujawniania ryzyka. Skonsultuj się z prawnikami i doradcami finansowymi, aby uzyskać porady dostosowane do Twojej sytuacji.

©2017 - 2024 Copyright by Cryptohopper™ - Wszelkie prawa zastrzeżone.