Technical Analysis 101: The 3 Signals to Help Spot a Bottom
In technical analysis, three standard signals will help you spot a bottom so you can buy low and sell high. While no trader or investor can call the bottom with 100% certainty, some standard technical signals appear in cryptocurrencies that are about to hit the bottom.
What is Technical analysis?
Technical Analysis is a tool used by traders to help predict future price movements of a security.
It is based on the premise that prices move in trends and that these trends can be identified and exploited.
Technical analysts use charts and other tools to look for patterns that may indicate where the price is headed.
Some of the most common signals used by technical analysts are moving averages, support and resistance levels, and momentum indicators.
Signal #1 Pick Up in Volume
A pick-up in the trading volume is one of the first significant signs that we’re about to bottom. Unfortunately, when writing, the Bitcoin trading volume is still depressed at low average values.
Price and volume represent the cornerstone of market structure, and when the trading activity starts to pick up after a sustained move to the downside, that’s a sign that we’re potentially bottoming out.
Signal #2 Selling Climax
A selling climax can be easily identified on the price chart as a massive price spike to the downside suddenly reversed.
Usually, the downtrend naturally exhausts itself after a prolonged move, often ending with a climax selling event. The climax selling events are often preceded by excessive pessimism.
Signal #3 When Bad News Gets Ignored by the Market
An overlooked tells of when a cryptocurrency is about to bottom is when the price starts ignoring negative news.
When negative news hits the market, the natural tendency is for the crypto price to depreciate. However, when this behavior is no longer visible, it signifies a fundamental shift in the market sentiment.
There is an old saying: "Bull markets ignore bad news, and any good news is the reason for a further rally."
We also wrote a blog about: How to Read a Crypto chart if you’re a Complete Beginner?

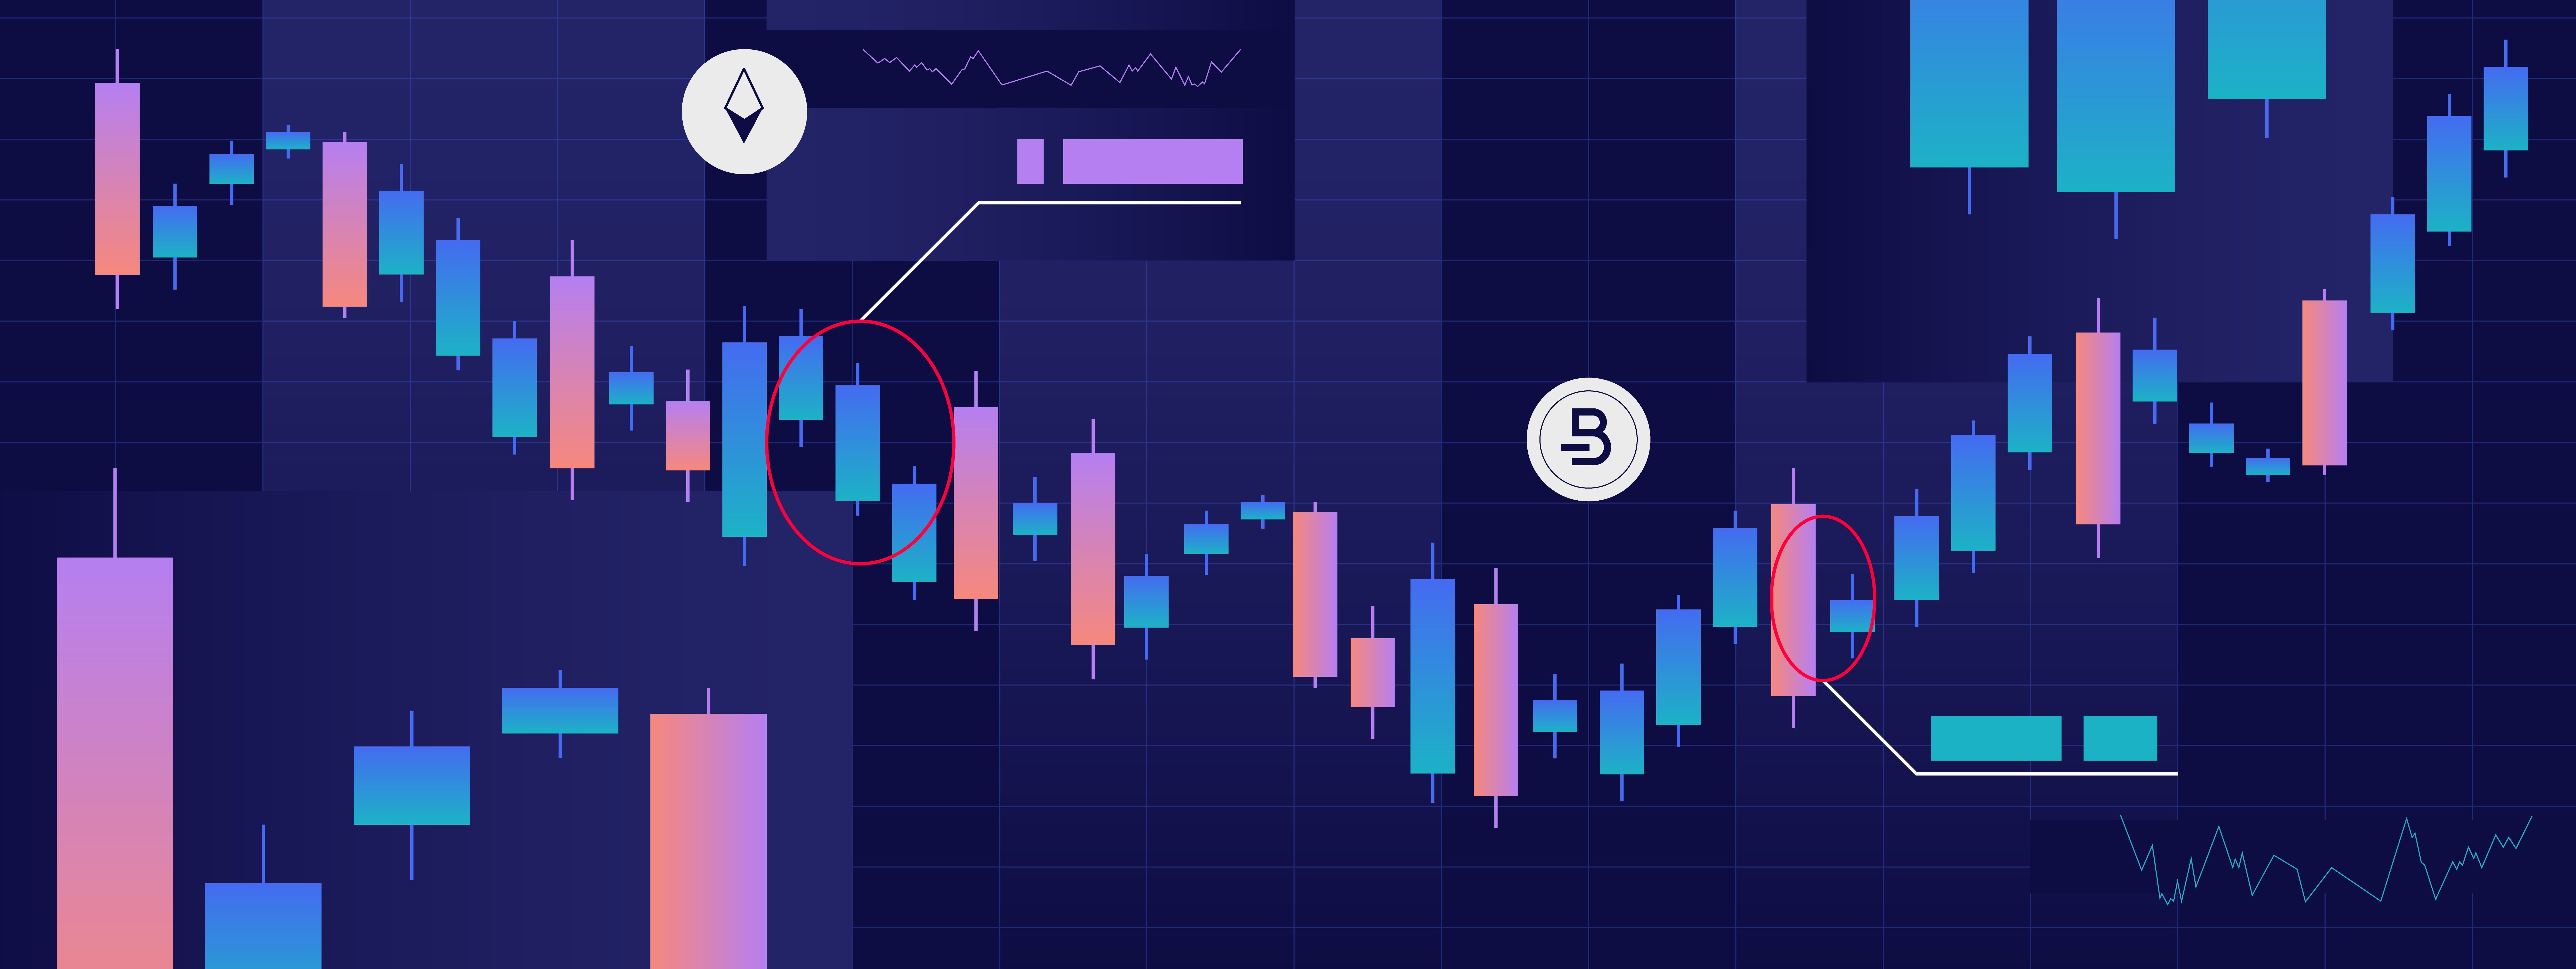
In technical analysis, trading using the candlestick price chart is a necessary skill to learn. The candlestick chart can help us determine entries, exits, the direction and strength of the trend, reversals, and much more.

