And trust us, once you’ve read through this guide, you will feel a lot more confident reading a candlestick chart and using it to your advantage. So let’s hop to it!
What is a candlestick chart?
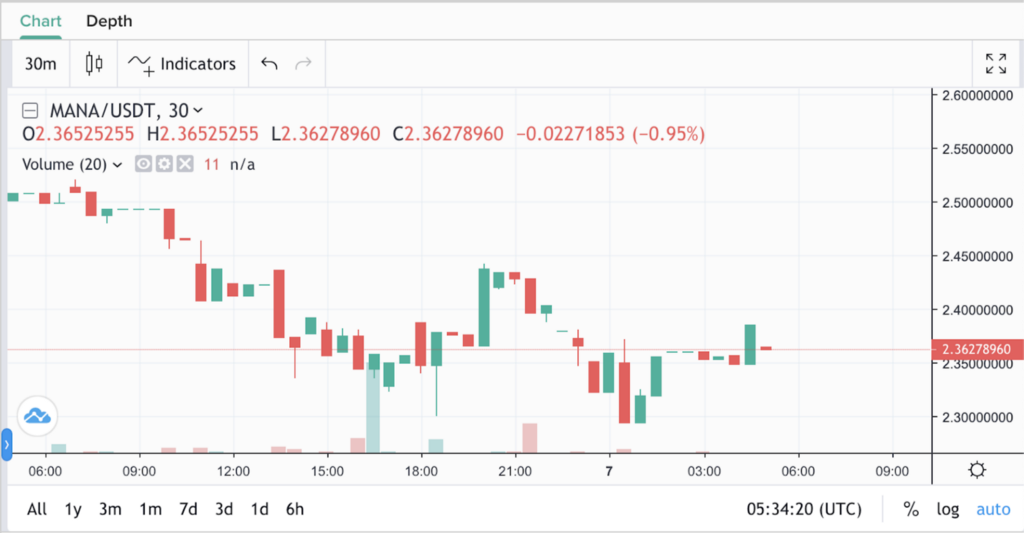
A candlestick chart tracks the movement of crypto prices over time. A green candle indicates a gain in price over a period of time, whereas a red candle indicates a decrease in price. Now, we mention the time period because depending on the timeframe of the candle you designate, the candlestick chart tells a certain story. A chart with hourly or minute by minute candles is a granular view, one that holds a magnifying glass to a cryptocurrency’s price trends. A chart with monthly candles, on the other hand, will show you a token’s history on a grander scale.
Anatomy of a candlestick chart
A candlestick chart’s main advantage is that it packs a lot of information in its design. So let’s go through its anatomy, shall we?
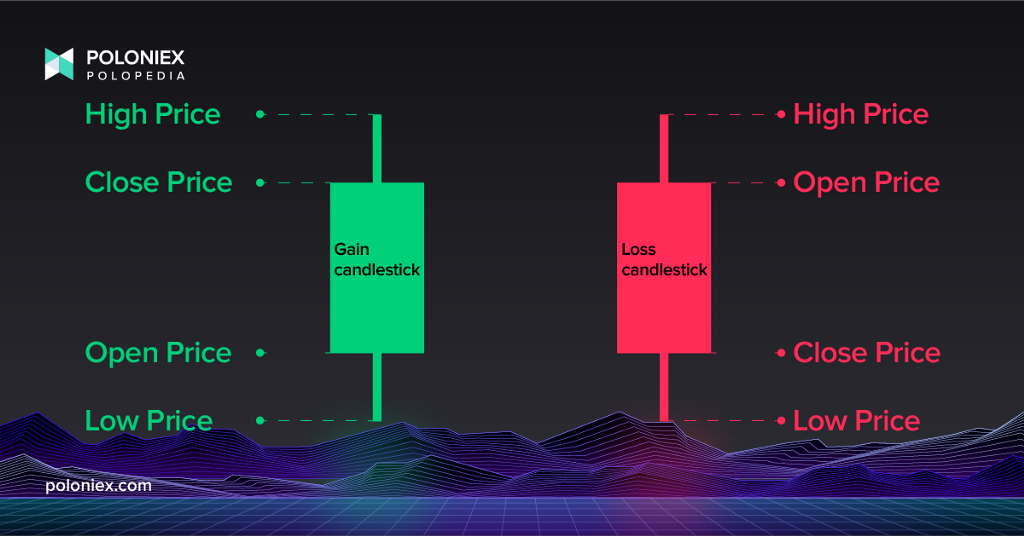
Body: the body gives you where a price “opened” and “closed”. The opening price happens at the beginning of the specific period, and the closing price happens at the end.
Wick: denoted by the thin lines of each candle, the wick represents how much the price has fluctuated. The top of the wick, called the upper shadow, represents the high of that specific period, and the bottom of the wick, called the lower shadow, represents the low.
Color: individual candles can be green or red. Green indicates a positive change in price (price closes above the opening price) and red indicates a negative change (price closes below the opening price).
Candlestick Patterns
Now that we have the look of a single candlestick down, let’s talk about the story it tells. A single candlestick shows you price movement, extremes and the closing and opening levels. In sequence, these characteristics can reveal patterns, and these patterns can be bearish or bullish. They help traders like yourself predict the market and act accordingly. For example, a trader might look out for something called a hammer or a shooting star pattern.
Bullish candlestick patterns
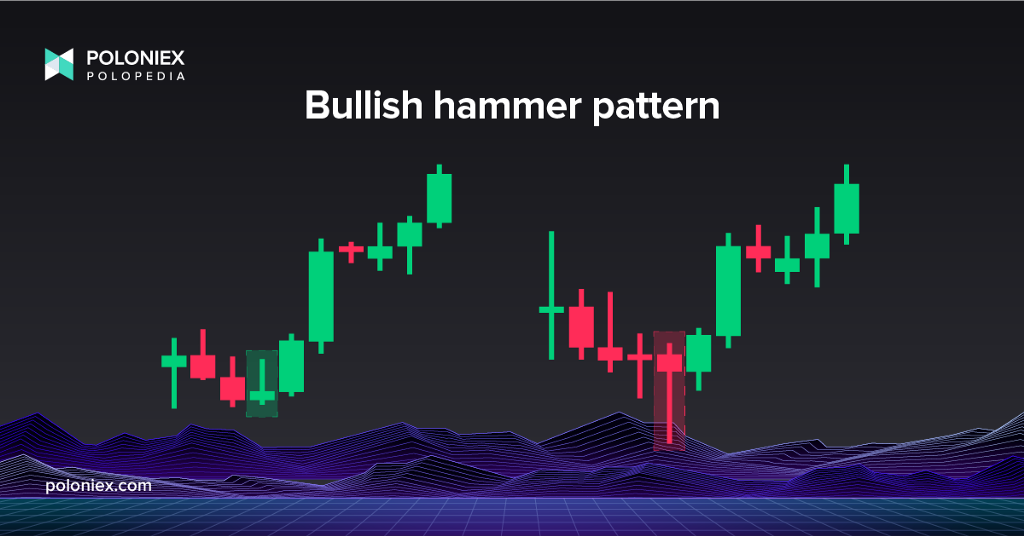
A bullish pattern means the price will likely rise. As previously mentioned, one pattern is the hammer pattern. Having a long upper wick and short body, the hammer pattern indicates that buyers have been able to pressure and reverse the price trend, pushing an asset’s price back up after a period of decline.
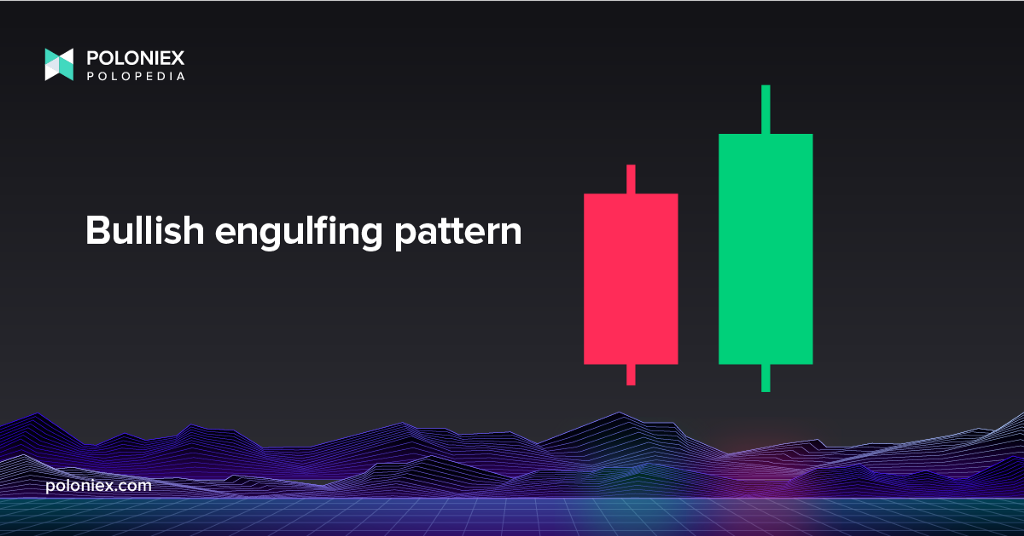
Another example of a bullish candlestick pattern can be the bullish engulfing pattern. This is represented by a red candlestick, then a green one that outsizes that previous red candlestick. It shows that buying pressure has increased, reversing a downtrend.
Bearish candlestick patterns
A bearish pattern means the price will likely decrease. As there is a hammer pattern, there is of course an inverted bearish hammer pattern, also known as the shooting star.
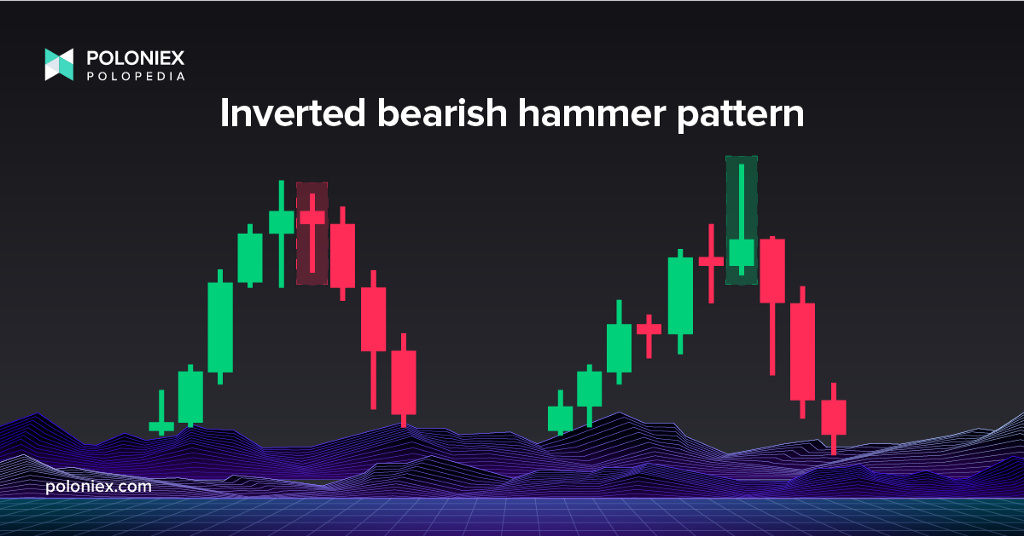
Having a long lower wick and short body, a shooting star pattern shows that sellers have pressured the market and caused a reversal, in this case a downtrend of that asset’s price after a period of gain.
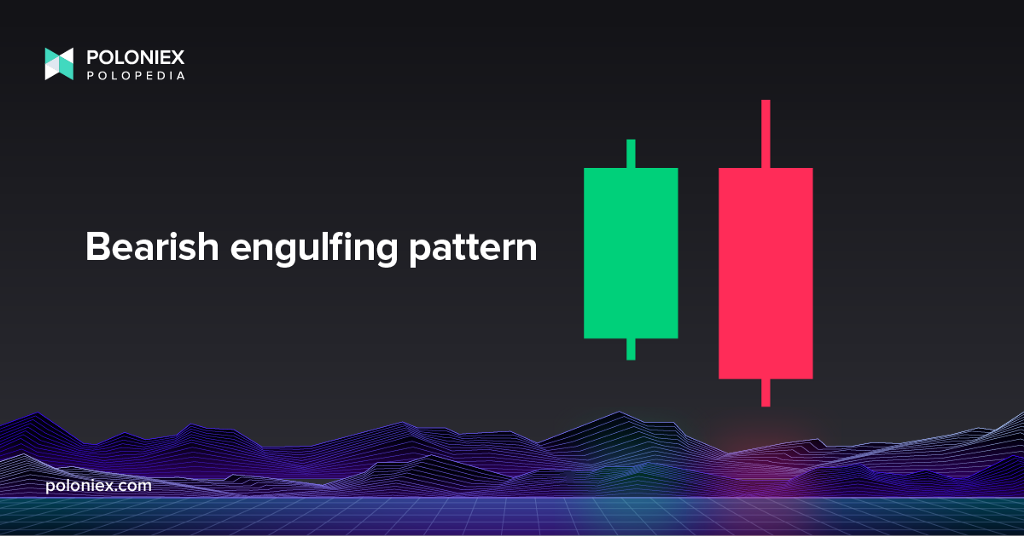
Another example of a bearish candlestick pattern is the bearish engulfing pattern. It will show a green candlestick, followed by an outsizing red candlestick. This shows that selling pressure is reversing an uptrend.
In learning about and analyzing these sorts of patterns, you will be able to take advantage of the information that they convey. Although trading can sometimes be emotional, it is important to make informed decisions. Being able to read and interpret candlestick charts will help you do that.
That’s it for now! These are the basic ideas behind a candlestick chart. Later on, we will release a more in-depth article going into other patterns, theory, as well as other terms like support and resistance levels. But for now, this guide will suffice to show you how to interpret a candlestick chart and make trading a bit more familiar, setting you up for success!
Feeling ready to get started? Sign-up is easy! Just hop on over to https://poloniex.com/signup/ to start your crypto journey🚀

was originally published in The Poloniex blog on Medium, where people are continuing the conversation by highlighting and responding to this story.