
Last 2 Times SHIBA Inu Showed This Signal, It Rallied Over 40%
Shiba Inu (SHIB) flashed a bullish signal that could trigger a rally of over 40%. That's a signal from a popular technical indicator called the MACD, which is a trend-following momentum indicator.
What is the MACD Bullish Signal?
The Moving Average Convergence Divergence (MACD) Bullish Signal is a technical indicator that is used to identify when a Crypto is potentially undervalued and may be due for a rally.
This signal is generated when the MACD line crosses above the signal line. This indicates that the Crypto is starting to gain momentum and could potentially continue to rise in value.
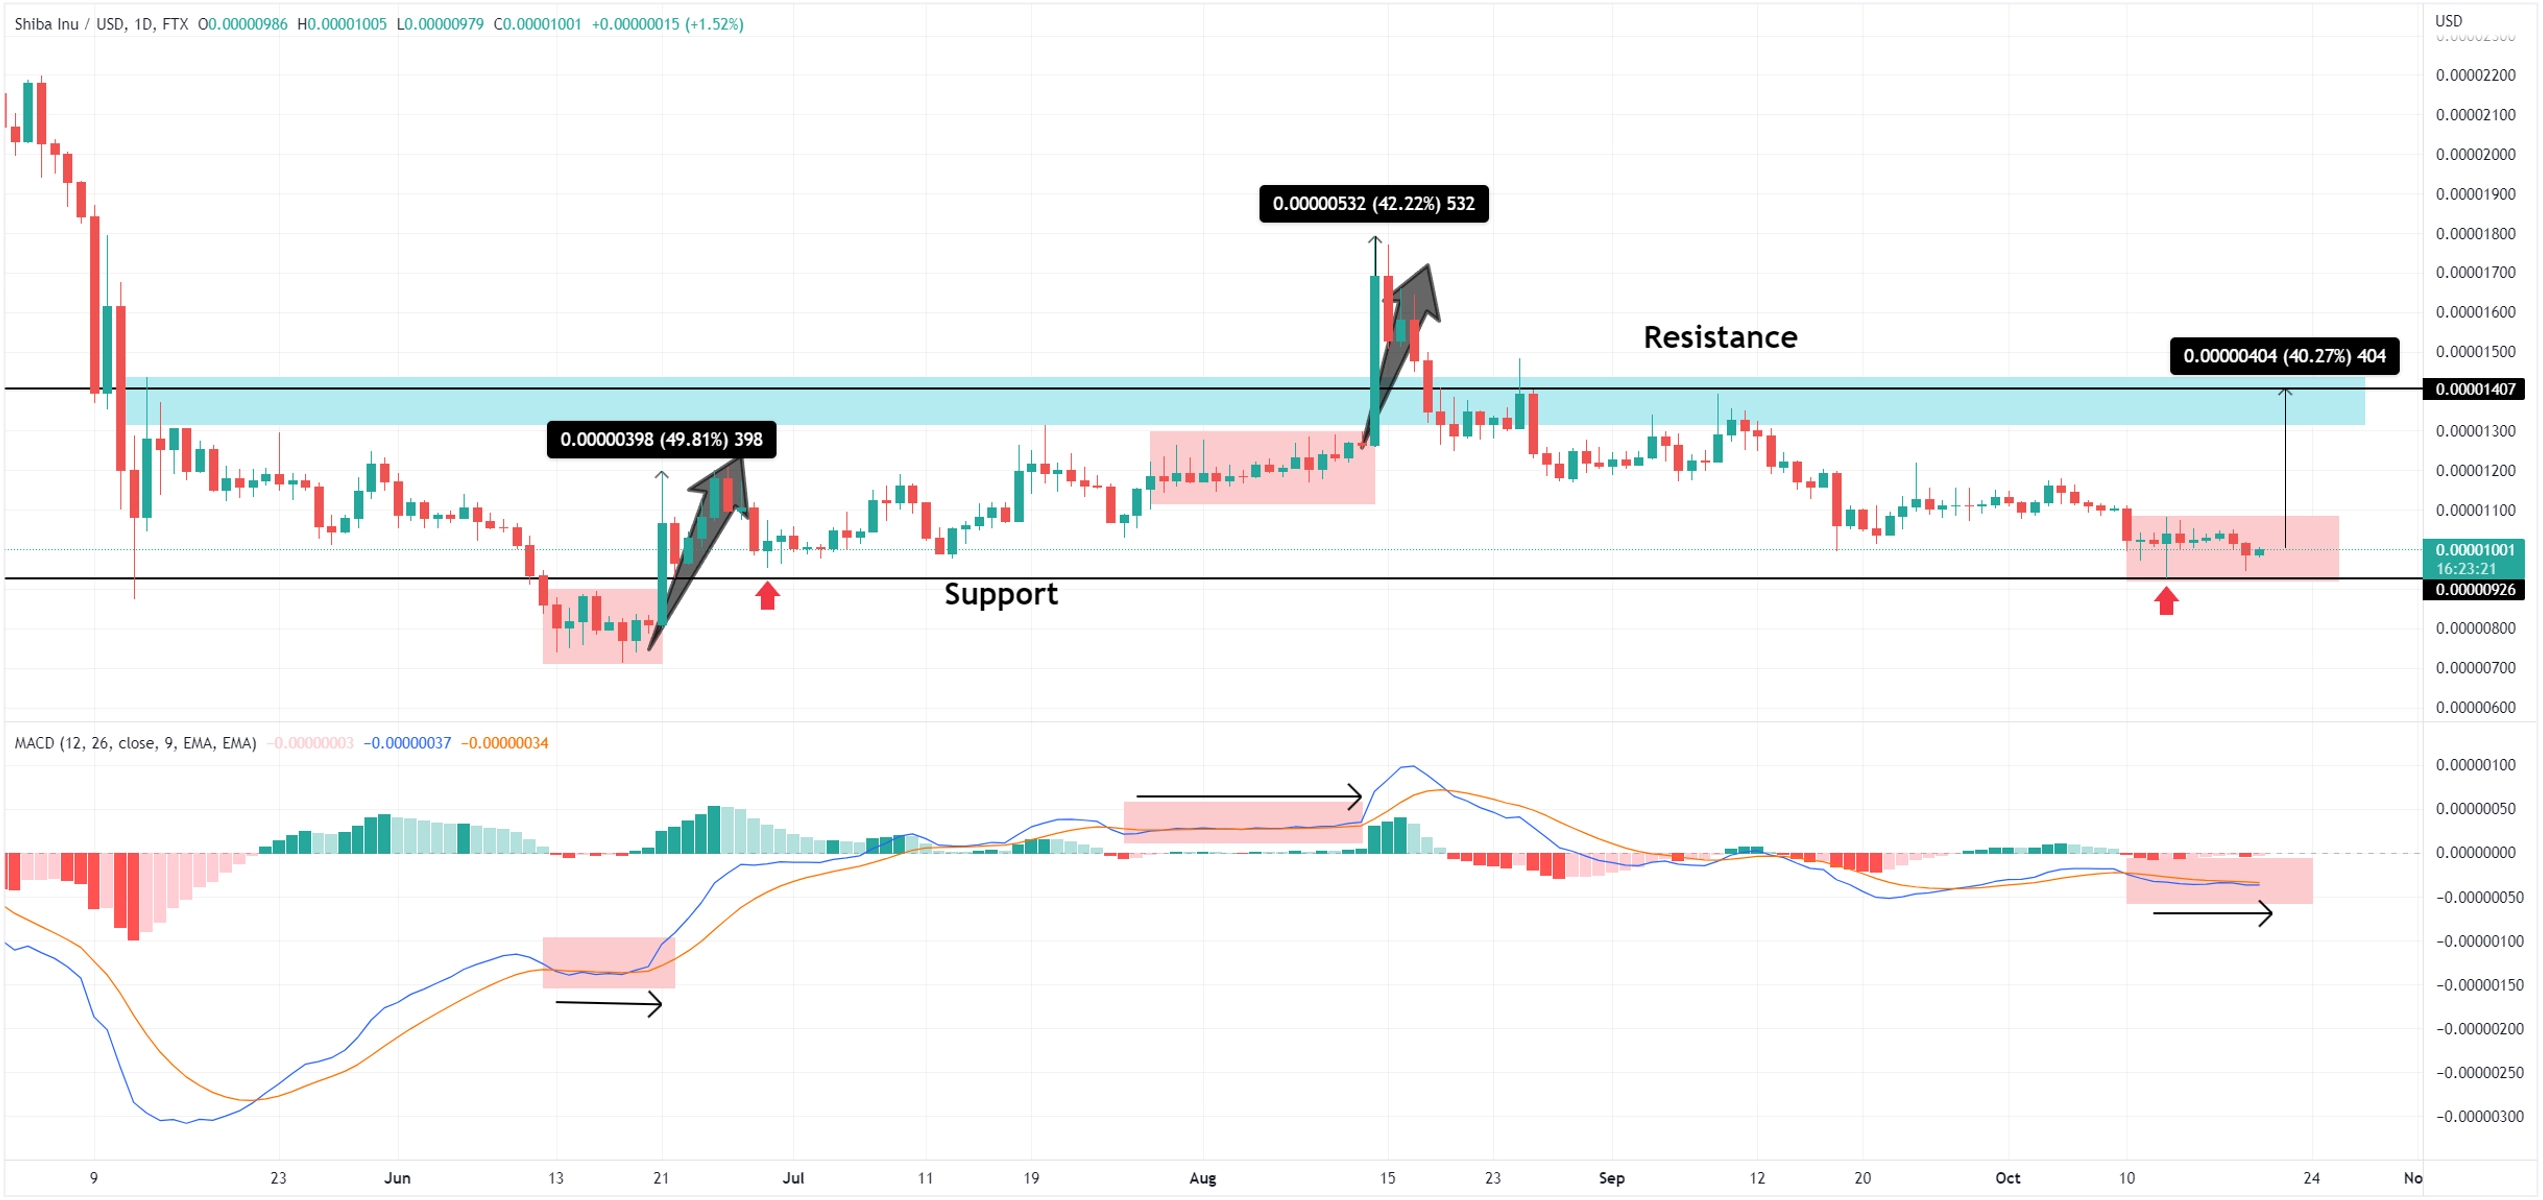
On the daily chart , the two moving averages have turned flat, almost horizontal even. The last two times this signal showed up, SHIBA Inu's price rallied over 40%. The first time the MACD's moving averages turned flat was in mid-June, while the second time it happened was in mid-August.
When we have sideways price activity, the two moving averages have a harder time moving away from each other.
In both instances, the subsequent rally was short-lived, so this signal tends to produce only short-term price reactions. We can see that it's irrelevant whether the moving averages are above or below the zero line. The mid-June signal was below the zero line, and yet the signal triggered a powerful reaction higher.
Looking forward: As long as the support level at $0.0000093 holds the downside, we can expect a potential rally. On the flip side, any rally can face difficulty at the $.0000140 resistance level, which represents exactly a 40% gain from the current price.


_webp.webp&w=3840&q=75)
_webp.webp&w=3840&q=75)


