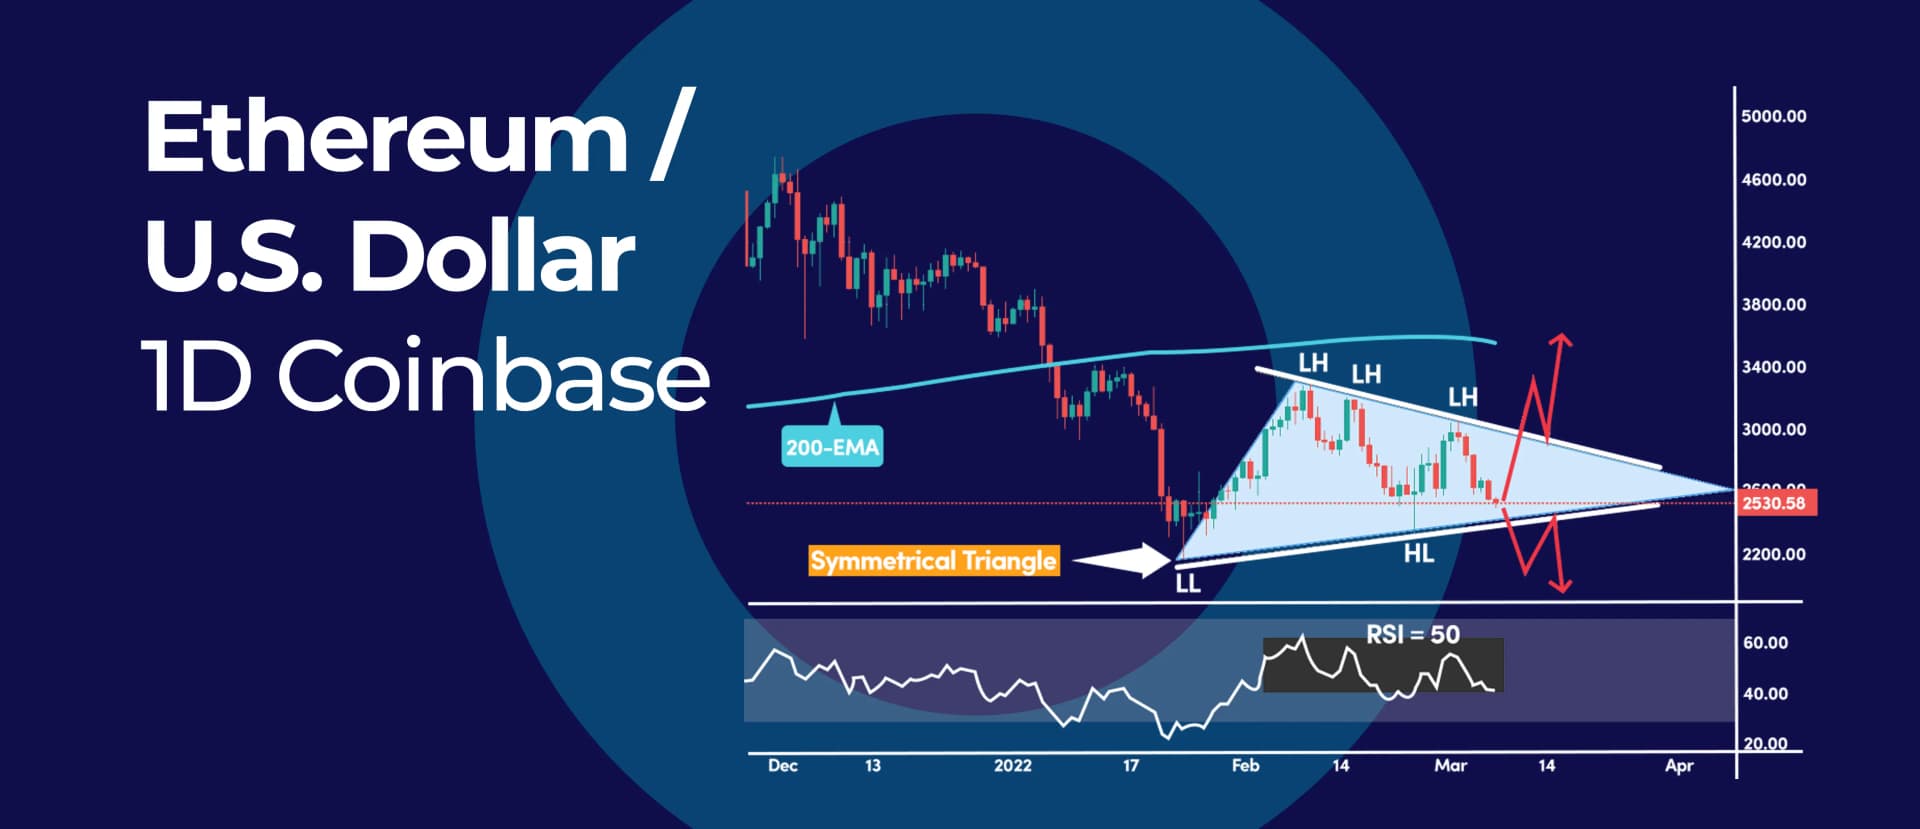
Ethereum's (ETH) price has been developing a 2-month symmetrical triangle on the daily chart, which warns of an impending breakout in either direction. The symmetrical triangle is a classical chart pattern but is a neutral chart formation. In this regard, the breakout can happen either on the short side or on the long side.
Symmetrical Triangle
Starting with the $2,159 low, ETH's price made a series of lower highs followed by a series of higher lows that can be connected with a descending trendline respectively ascending trendline.
The neutrality of the symmetrical triangle pattern is also highlighted by the Relative Strength Index (RSI) oscillator, which is hovering above and below the 50 mid-level.
This signals that neither the bulls nor the bears are entirely in control and that we have an equilibrium price between the $3,300 high and $2,159 low.
A break to the upside will put back in focus the critical 200-day Simple Moving Average (SMA).
The bulls need to secure a break and close above the 200-day Simple Moving Average to shift the trend to the upside. On the flip side, a break to the downside would put back in focus the current bottom at $2,159.
Looking forward: ETH's price is expected to consolidate further within the upper and lower limits of the symmetrical pattern.


_webp.webp)
_webp.webp)