0%
Bitcoin Performs Breakout!
#BTC#Bull market#support and resistance+2 más etiquetas

Bitcoin Performs Breakout!

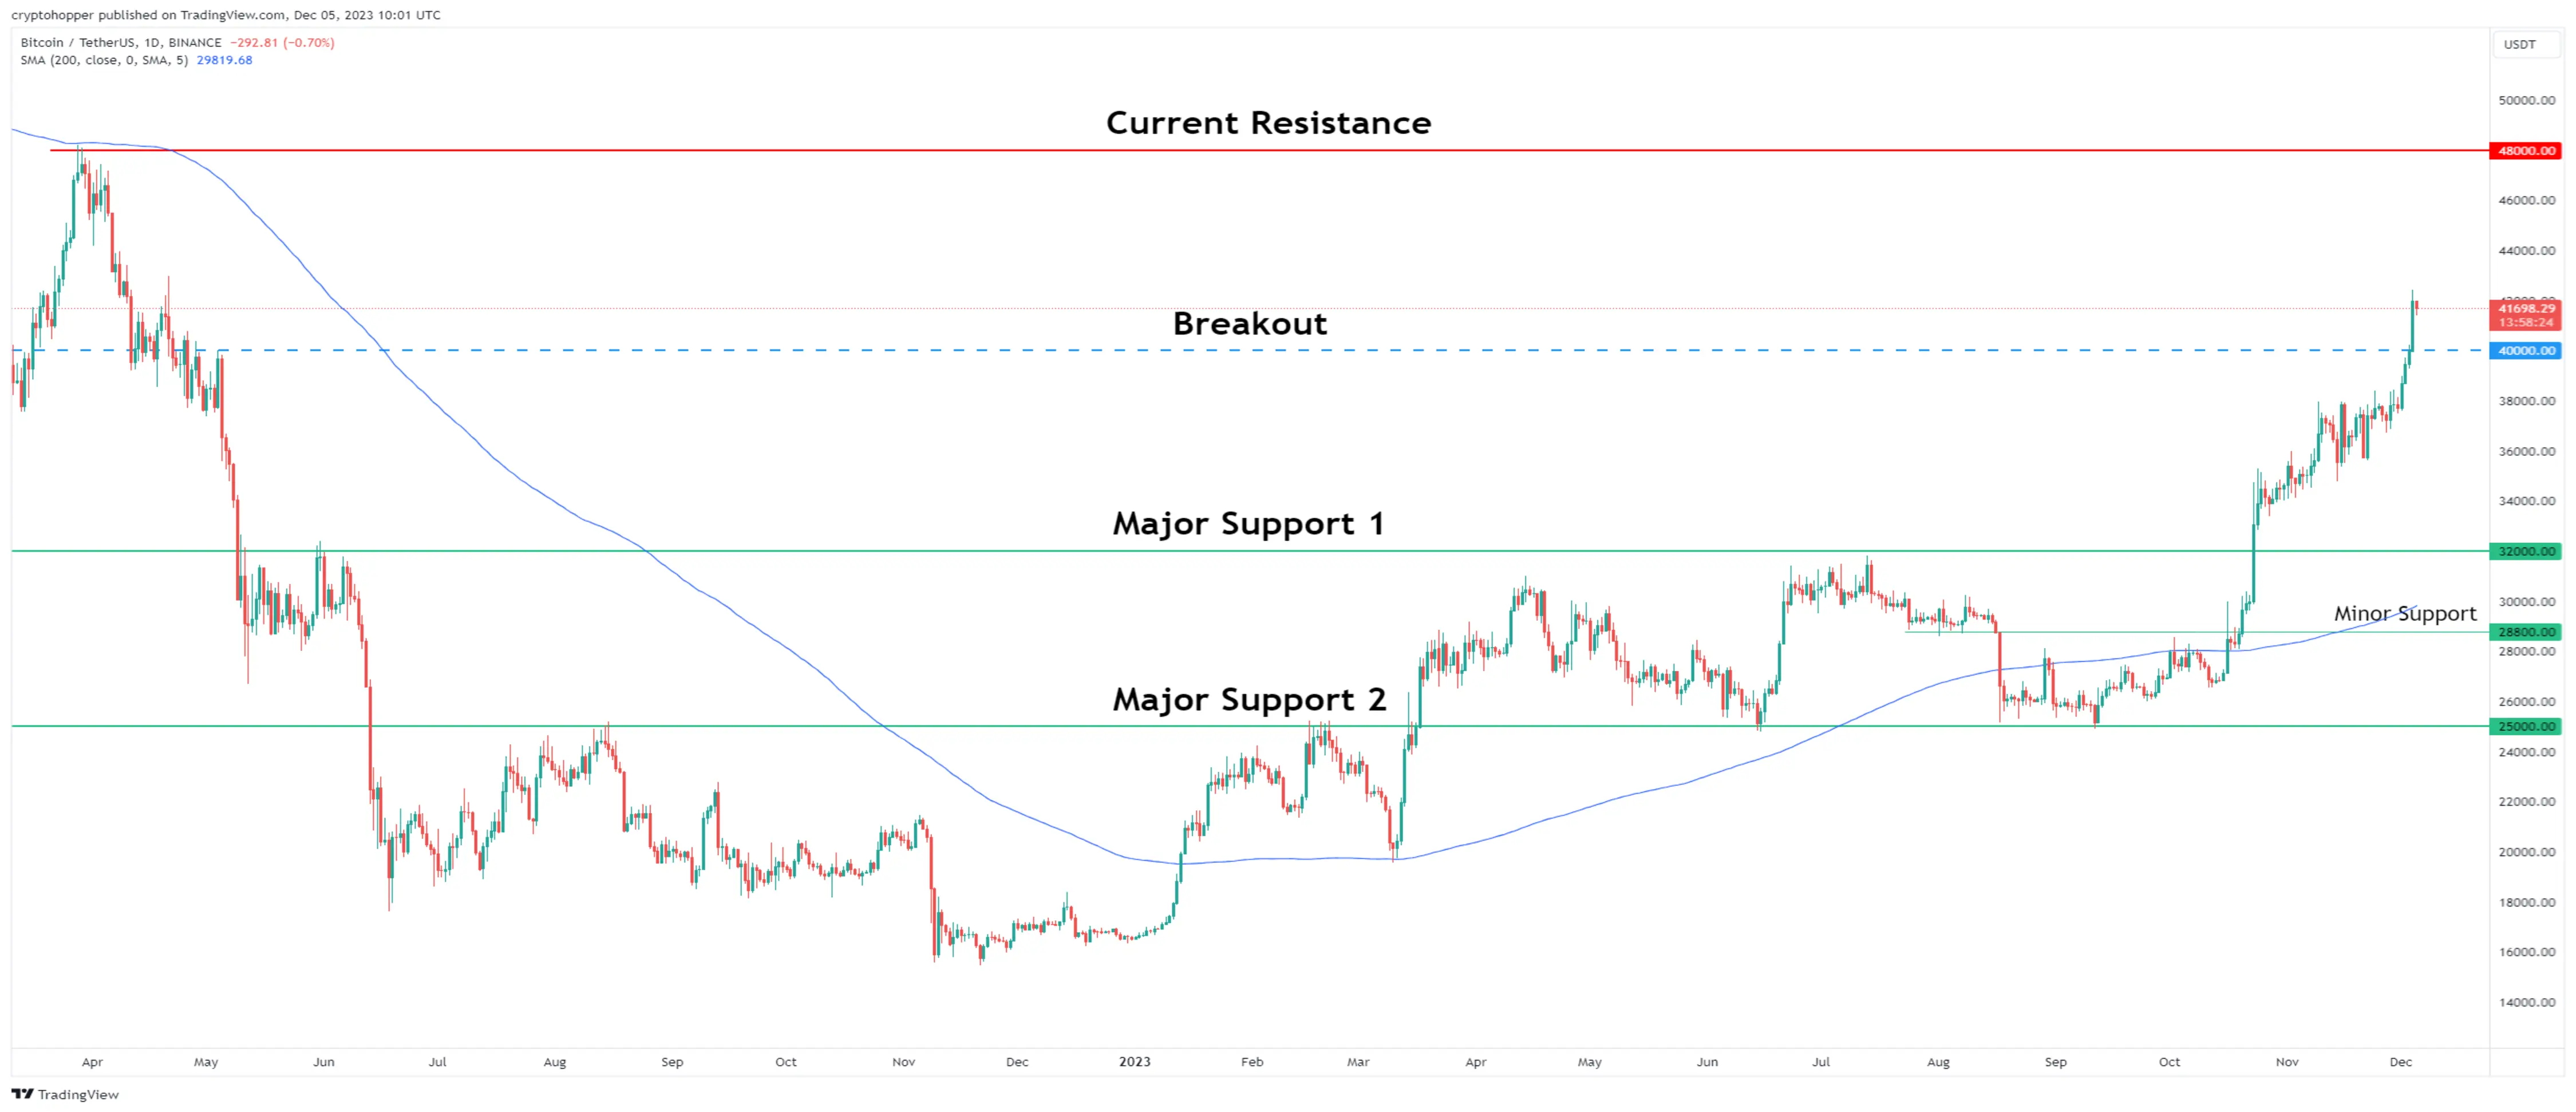
Bitcoin surges past $40,000, eyeing $48,000. Key supports at $40,000, $32,000, with the 200 SMA indicating market trends.

On Monday, December 4th, Bitcoin (BTC) made a remarkable move, surging beyond the $40,000 mark and registering a substantial 5% gain within a single day. The burning question now is whether this upward momentum will persist and, if so, for how long? Conversely, could the market encounter a downturn, and if it does, what might be the potential extent of the decline? Let's delve into the details to uncover the possibilities!
Bitcoin Performs Breakout Chart

Chart by TradingView

Should Bitcoin maintain its current upward trajectory, its sights may be set on the next significant resistance level, approximately $48,000. This level represents an ascent of more than 15% from the present price point. Furthermore, if the price successfully breaches this threshold, it would bring the coveted All-Time High of $69,000 within reach, serving as the subsequent resistance to conquer.

Considering the Downside

Conversely, in the event that BTC loses its bullish momentum and undergoes a corrective phase, there's a pivotal support at $40,000. Should this level falter to uphold its support role, the $32,000 level stands as the subsequent critical support zone to watch.

Adding to this, the daily 200 Simple Moving Average (SMA) assumes a mobile support role in this price journey. When BTC maintains a position above the 200 SMA, this moving average functions as a supportive foundation. Conversely, when the price descends below it, the 200 SMA transforms into a formidable resistance.

Historically, breaking above the 200 SMA has signified a tendency for the price to sustain such a position for a protracted period. Notably, during the 2020 bull run, the price remained above the 200 SMA for longer than a year.

Bottom Line: Bitcoin's recent breakout above $40,000 is generating optimism. It may target $48,000 and even approach the All-Time high of $69,000 if the uptrend persists. On the downside, $40,000 and $32,000 serve as key support levels. The daily 200 SMA, a critical indicator, could signal an extended bullish trend akin to the 2020 bull run.

Imagen de la bandeja de entrada

Boletín

Recibe el correo electrónico semanal con análisis de crypto exclusivos noticias que vale la pena leer. Mantente informado y entretenido, gratis.

Automatiza
tus
operaciones.

Bot automatizado de clase mundial para el Trading de criptomonedas

Comencemos
Automatiza tus operaciones

Artículos relacionados

Bot Trading 101 | How To Apply a Scalping Strategy
#Automated trading strategy#Strategy designer#EMA+3 más etiquetas

Bot Trading 101 | How To Apply a Scalping Strategy

Cryptocurrencies | BTC vs. USDT As Quote Currency
#Bitcoin#crypto trading#crypto trading tips+2 más etiquetas

Cryptocurrencies | BTC vs. USDT As Quote Currency

Technical Analysis 101 | What Are the 4 Types of Trading Indicators?

Technical Analysis 101 | What Are the 4 Types of Trading Indicators?

Bot Trading 101 | The 9 Best Trading Bot Tips of 2023
#crypto trading#trading bot#crypto trading tips+2 más etiquetas

Bot Trading 101 | The 9 Best Trading Bot Tips of 2023

¡Comienza a operar gratis con Cryptohopper!

Uso gratuito, sin tarjeta de crédito.

Comencemos
Cryptohopper appCryptohopper app

Descargo de responsabilidad: Cryptohopper no es una entidad regulada. El Trading de bots de criptomoneda implica riesgos sustanciales, y el rendimiento pasado no es indicativo de resultados futuros. Las ganancias mostrados en las capturas de pantalla de los productos tienen fines ilustrativos y pueden ser exagerados. Participe en el Trading con bots únicamente si posee conocimientos suficientes o busque la orientación de un asesor financiero cualificado. Bajo ninguna circunstancia Cryptohopper aceptará responsabilidad alguna ante ninguna persona o entidad por (a) cualquier pérdida o daño, total o parcial, causado por, derivado de o en relación con transacciones que impliquen nuestro software o (b) cualquier daño directo, indirecto, especial, consecuente o incidental. Tenga en cuenta que el contenido disponible en la plataforma de Trading social Cryptohopper es generado por los miembros de la comunidad Cryptohopper y no constituye asesoramiento o recomendaciones de Cryptohopper o en su nombre. Las ganancias mostrados en el Marketplace no son indicativos de resultados futuros. Al utilizar los servicios de Cryptohopper, usted reconoce y acepta los riesgos inherentes al Trading de criptomonedas y se compromete a eximir a Cryptohopper de cualquier responsabilidad o pérdida en que incurra. Es esencial revisar y comprender nuestras Condiciones de servicio y Política de divulgación de riesgos antes de utilizar nuestro software o participar en cualquier actividad comercial. Consulte a profesionales jurídicos y financieros para obtener asesoramiento personalizado en función de sus circunstancias específicas.

©2017 - 2024 Copyright por Cryptohopper™ - Todos los derechos reservados.