Whether you’re just getting started with technical analysis or you’re a seasoned trader refining your edge, understanding moving averages is a fundamental skill that can level up your trading decisions.
Let’s start with the basics: SMA vs EMA.
What Are Moving Averages?
Price charts can be messy and complicated. Every second, prices tick up and down, creating a whirlwind of data that can overwhelm even experienced traders.
Moving averages help you step back from the chaos and spot the real trend.
They smooth out price data over a specific time period, making it easier to identify whether the market is trending upward, downward, or simply consolidating.
At their core, moving averages are used to:
Identify market direction
Highlight potential entry/exit zones
Confirm signals from other indicators
Avoid emotional trading based on short-term volatility
There are two main types of moving averages you’ll see on any trading platform: the Simple Moving Average (SMA) and the Exponential Moving Average (EMA).
Let’s break them down.
Simple Moving Average (SMA): The Calm, Long-Term Lens
On Bitfinex, this appears as: Moving Average (MA)
The SMA takes the closing prices over a set number of periods (e.g. 10, 50, or 200), adds them together, and divides by that number. Every price has equal weight. The SMA doesn’t react to every wiggle, just shows you the average direction over time.
Example: A 50-day SMA adds up the past 50 closing prices and divides by 50.
Common Use Cases:
Swing traders often use the 50-day and 200-day SMA to assess long-term momentum.
Trend followers watch for price crossing above or below the SMA to signal possible reversals.
Pros:
Smooth and stable
Great for filtering out short-term noise
Strong long-term trend confirmation
Cons:
Reacts slowly to sudden price changes
Might miss early signals in fast-moving markets
Exponential Moving Average (EMA): The Agile Trend Tracker
The Exponential Moving Average also calculates an average price, but it gives more weight to recent prices, making it more sensitive to current market movements.
Example: A 20-day EMA still includes the last 20 days of prices, but today’s data influences it more than data from two weeks ago.
EMAs are favored by day traders and scalpers who need to respond quickly to momentum shifts.
Common Use Cases:
Short-term traders rely on 9-day, 12-day, or 20-day EMAs to catch fast-moving trends.
EMAs are often used in crossover strategies, where a short-term EMA crossing a long-term EMA can indicate entry or exit signals.
Pros:
Reacts faster to recent price action
Useful for spotting trend reversals early
Preferred in fast-paced trading environments
Cons:
Can generate more false signals during choppy markets
May be too reactive in sideways markets
SMA vs EMA – Which Should You Use?
There’s no one-size-fits-all answer. The best choice depends on your trading style, time horizon, and goals.
Most experienced traders use both. For example:
Trend confirmation with a 200-day SMA
Entry signals with a 20-day EMA
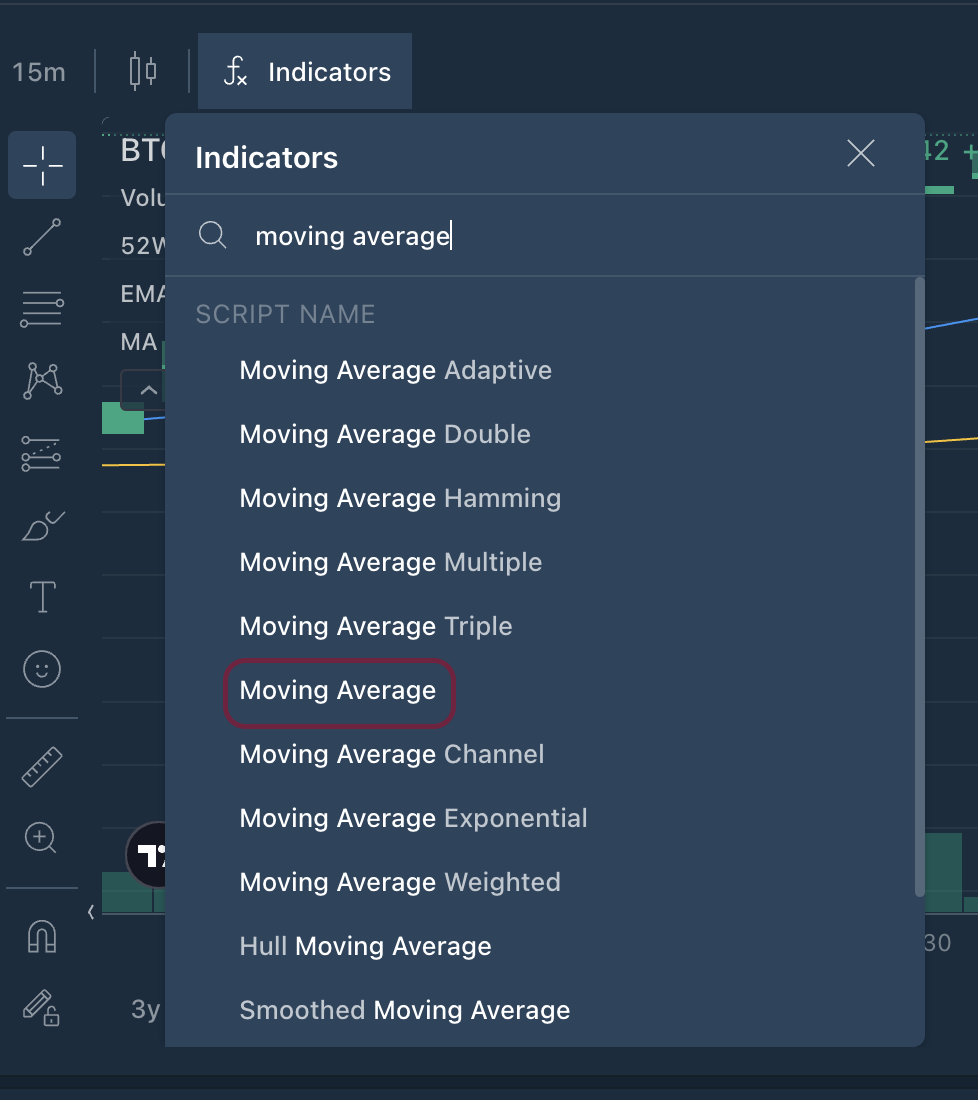
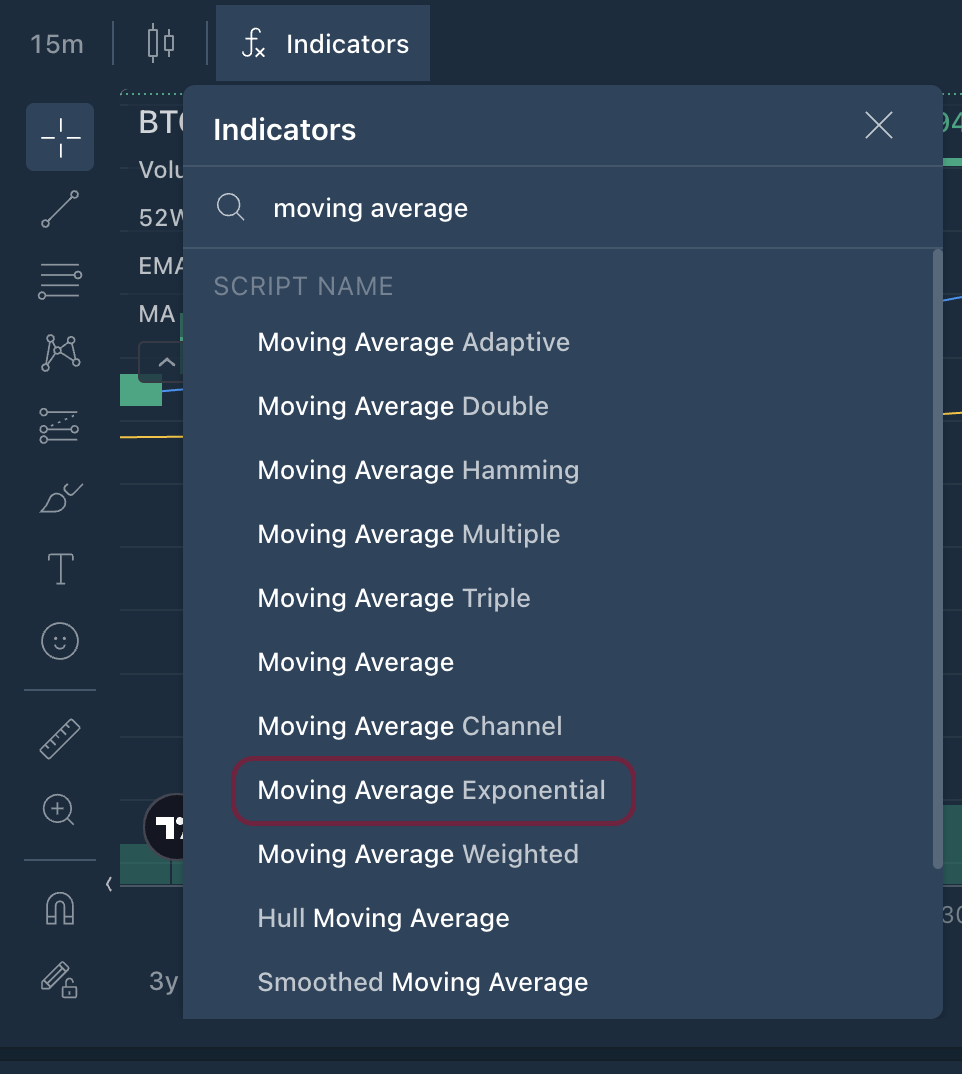
Try This: Apply It On Your Bitfinex Charts
Want to put this into action right now?
Log in to Bitfinex
Choose a chart (e.g. BTC/USD)
From the Indicators tab, add:
A 50-day SMA
A 20-day EMA
Watch how they behave during trends and crossovers.
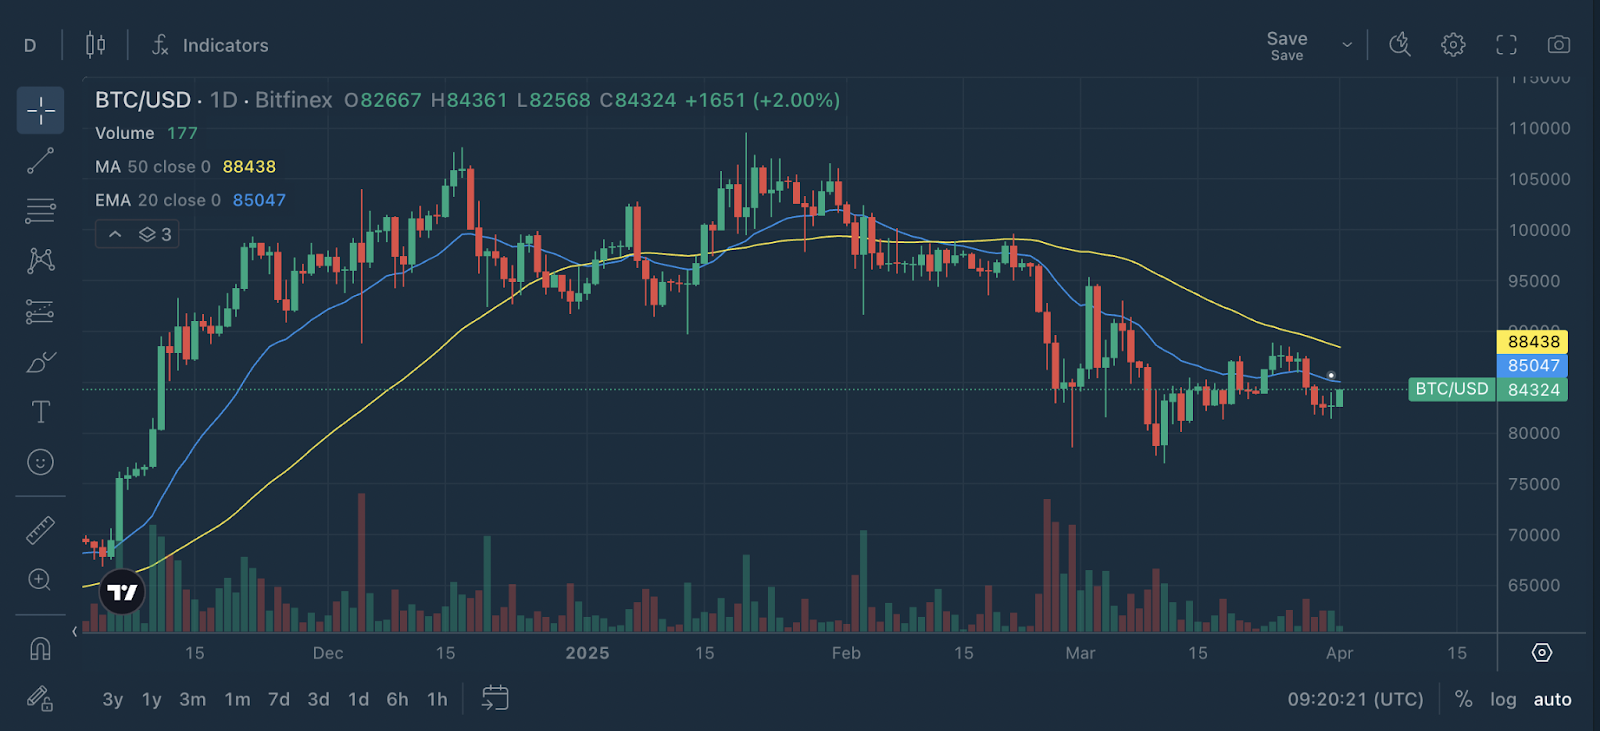
You’ll start to notice patterns:
20 EMA < 50 MA: Short term price weakness relative to long term trend
Price < 50 MA: Market is still below the long term trend average, proceed with caution
Price slightly < 20 EMA: Trying to reclaim momentum but not fully there yet
This simple practice will sharpen your chart-reading skills more than any theory ever could.
SMA and EMA are the foundation of countless trading strategies. Whether you’re using them as a standalone trend filter or combining them with other tools like MACD or RSI, mastering these indicators gives you a clearer, calmer way to trade.
Coming up next in our series to Master your Charts: How to use MACD to spot momentum shifts before the crowd.
The post appeared first on Bitfinex blog.