Crypto Trading 101: Identifying the Trend and Making a Profit with Bollinger Bands
Have you always wondered how to identify when Bitcoin is volatile and in which direction it is heading? You can identify both volatility and direction with the Bollinger Bands!
Identifying direction with the Bollinger Bands

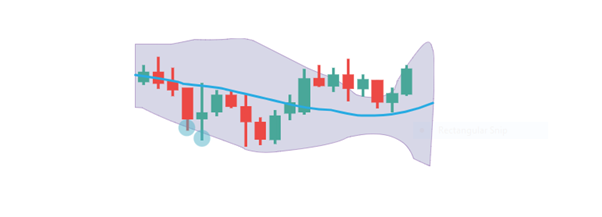
Bollinger Bands (BB) is a volatility indicator displayed by a moving average and an upward and lower band.
Both bands are typically 2 standard deviations away. When the bands tighten, there is less volatility in the market, and a big move is expected to occur soon after.
This can be very useful as you can essentially predict when we will enter a volatile period.
When the bands are very far apart, the market volatility is considered to be very high. The 1-day chart usually works best in determining the overall market volatility and direction.
The Bollinger Bands can also be used to identify the direction of the market.
For example: When the bands are tight, and then the price breaks through the upward band and the EMA points upwards at the same time, the indicator suggests that a bullish trend has commenced.
This is again best used on the daily chart to predict the prevailing trend.
Limitations of Bollinger Bands
One of the main limitations of the Bollinger Bands is that it is a lagging indicator. This means that it often doesn’t predict the trend or it misses the start of a new trend.
This is why it is important to use the Bollinger Bands in combination with an additional indicator, for example, the Exponential Moving Average (EMA), to determine the direction of the market.
Another important thing to keep in mind is that the Bollinger Bands are not exactly the same on every exchange.
The settings can differ per exchange and even per coin. On Cryptohopper, we use the most common settings.
Scalping with the Bollinger Bands
On Cryptohopper, we give you the opportunity of scalping with the Bollinger Bands. On Cryptohopper, a buy signal is given when the price falls below the lower Bollinger Band, and a sell signal is given when the price rises above the upper Bollinger Band.
This system usually works best on the 30 minutes chart.
It doesn't work as well on all coins though. For example, on THETA, it would have made a 1,000% profit over the last year (assuming 0.1% fees), but on BTC, it only would have made 100%.

