
Polygon Inverse H&S Pattern Calls For a Reversal
Polygon's (MATIC) bullish chart pattern may point to a move towards $1.2, meaning the cryptocurrency price could almost double. However, the daily chart's inverse Head and Shoulder pattern usually signal a reversal of the prior trend.
What is Polygon (MATIC)
Polygon is a cryptocurrency that was created in 2017.
It is based on the Ethereum network and provides users with a way to trade tokens without having to pay fees.
The native token of the Polygon network is called MATIC. MATIC can be used to pay for transaction fees on the network or it can be staked to earn rewards.
The price of MATIC has fluctuated since it was first listed on crypto exchanges in 2017. However, the price has increased significantly in 2021 as more people have become interested in the project.
Inverse Head and Shoulder Pattern
The inverse Head and Shoulder pattern is a bullish signal.
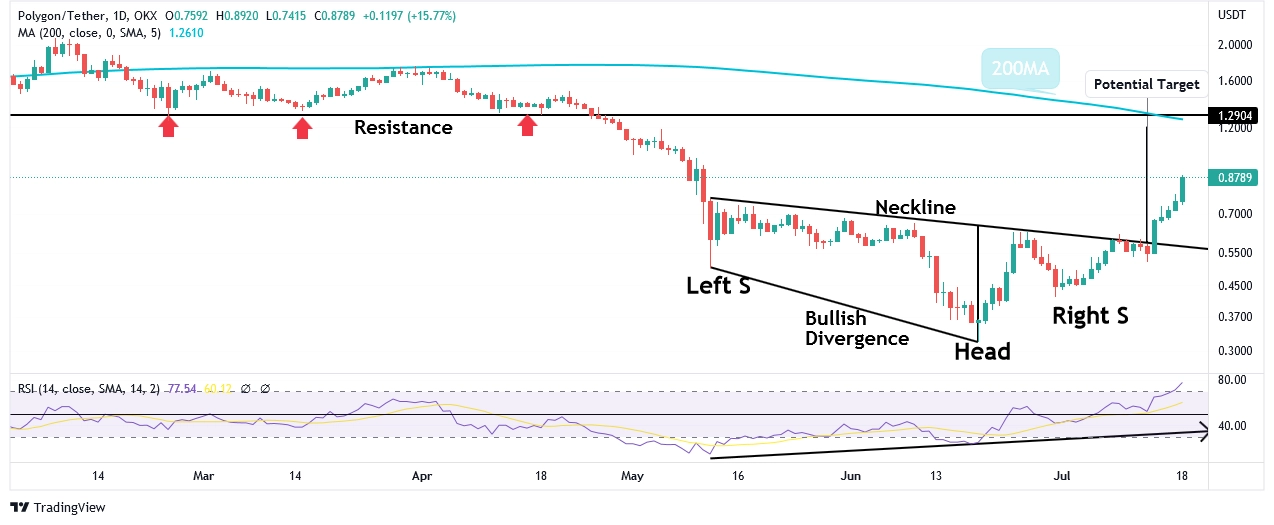
The price formation has printed the left shoulder at the $0.50 low while the head was published at the $0.31 low. Up from here, the right shoulder developed higher at $0.41.
The fact that we have a massive divergence between the left shoulder and the head is another positive sign that favors the Head and Shoulder pattern.
What is a Inverse Head and Shoulder Pattern?
An inverse head and shoulder pattern is a chart formation that signals a potential reversal in the direction of the trend. The pattern is made up of three distinct peaks, with the middle peak being the highest and the two outside peaks being lower.
The "shoulders" are usually of equal height. This formation occurs when the price of an asset is making lower highs and higher lows, and is considered a bullish signal.
Head and Shoulder Price Target
Usually, the profit target of the Head and Shoulder pattern is the height of the pattern (the distance between the head and the neckline) added to the breakout price.
So as long as we're trading above the pattern's neckline, the $1.2 target can come into play for the cryptocurrency.
The $1.2 target also aligns almost perfectly with the 200-day moving average, which has the potential to cap the rally.
At the same time, the Relative Strength Index (RSI) oscillator is starting to spend more time above the 50 mid-level, which is encouraging for the bullish price scenario.


_webp.webp&w=3840&q=75)
_webp.webp&w=3840&q=75)


