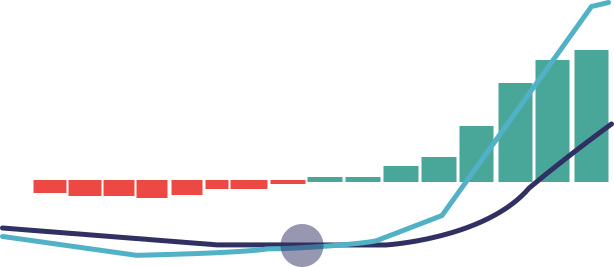
Using the Percentage Price Oscillator (PPO) Efficiently
The Percentage Price Oscillator (PPO) is a momentum indicator that compares a 26-period and a 12-period Exponential Moving Average (EMA) as a percentage, helping traders assess performance and identify potential price reversals.
The Percentage Price Oscillator (PPO) is a technical momentum indicator that illustrates the relationship between two moving averages, expressed in percentage terms. Specifically, it compares a 26-period Exponential Moving Average (EMA) with a 12-period EMA.
Using the PPO allows you to assess a cryptocurrency's performance and volatility more effectively. It helps in identifying divergences that could signal potential price reversals, generating trade signals, and confirming the direction of a trend. By incorporating the PPO into your analysis, you gain a clearer perspective on the momentum behind price movements, enhancing your ability to make informed trading decisions.
How the Percentage Price Oscillator (PPO) Functions
The Percentage Price Oscillator (PPO) operates similarly to the Moving Average Convergence Divergence (MACD) indicator, with a key difference: while the MACD measures the absolute (dollar) difference between two exponential moving averages (EMAs), the PPO calculates this difference in percentage terms.

This percentage-based approach makes the PPO particularly useful when comparing cryptocurrencies with varying price levels, as a PPO value of 10 consistently indicates that the short-term EMA is 10% above the long-term EMA, regardless of the cryptocurrency's price.
Trade signals generated by the PPO follow the same principles as those from the MACD. A buy signal occurs when the PPO line crosses above the signal line from below, and a sell signal is triggered when the PPO line crosses below the signal line from above.
The signal line itself is derived by applying a nine-period EMA to the PPO line. These crossovers are further interpreted based on the PPO's position relative to the zero or centerline.
When the PPO is above zero, it confirms an uptrend, indicating that the short-term EMA is above the longer-term EMA. Conversely, a PPO below zero signifies a downtrend, with the short-term EMA below the long-term EMA.
Some traders choose to act on buy signals only when the PPO is above zero or when the price trend is upward. Similarly, when the PPO is below zero, they might disregard buy signals or focus solely on short-selling opportunities.
Centerline crossovers also provide important trading signals. Moving from below to above the centerline is seen as bullish, suggesting a potential upward trend, while crossing from above to below the centerline is considered bearish, indicating a possible downward trend. These crossovers occur when the 12-period and 26-period moving averages intersect.
Additionally, the PPO can be used to identify technical divergences between the indicator and the price. For instance, if a cryptocurrency's price reaches a higher high but the PPO forms a lower high, it may signal weakening upward momentum. Conversely, if the price hits a lower low while the PPO records a higher low, it could indicate that selling pressure is diminishing and the price may rise soon.
Drawbacks of Using the Percentage Price Oscillator (PPO)
The Percentage Price Oscillator (PPO) can sometimes generate false crossover signals, both with signal line crossovers and centerline crossovers. For example, if the price is rising but then moves sideways, the two EMAs may converge during this period, leading to a signal line crossover and potentially a centerline crossover.
However, the price hasn't actually reversed or changed direction—it has simply paused. This behavior means that relying solely on the PPO for trade signals can be misleading.
Another issue with the PPO is the occurrence of multiple crossovers before a strong price movement develops. These frequent crossovers without significant price changes can result in several losing trades, as the expected move may never fully materialize.
While the PPO is useful for identifying divergences that might indicate a price reversal, divergence itself isn't a precise timing tool. It can persist for an extended period and doesn't always lead to a price reversal, making it an unreliable sole indicator for predicting market movements.
Additionally, the PPO is calculated based on the percentage difference between two EMAs and an EMA of the PPO itself. These calculations reflect past price actions and do not inherently predict future movements. Essentially, the PPO provides insight into what has already happened in the market rather than forecasting what will occur next, limiting its predictive power.
Bottom Line
The Percentage Price Oscillator (PPO) is a valuable tool for assessing momentum, identifying potential reversals, and generating trade signals based on the relationship between two moving averages. Its percentage-based approach makes it particularly useful for comparing cryptocurrencies with different price levels.
However, like any indicator, the PPO has limitations, including false signals and the risk of multiple crossovers without significant price movements. To use the PPO effectively, it should be combined with other technical analysis tools to confirm trends and avoid relying solely on its signals for trading decisions.

