_webp.webp&w=3840&q=75)
Bullish Belt Hold What It Is, and How Can You Use It
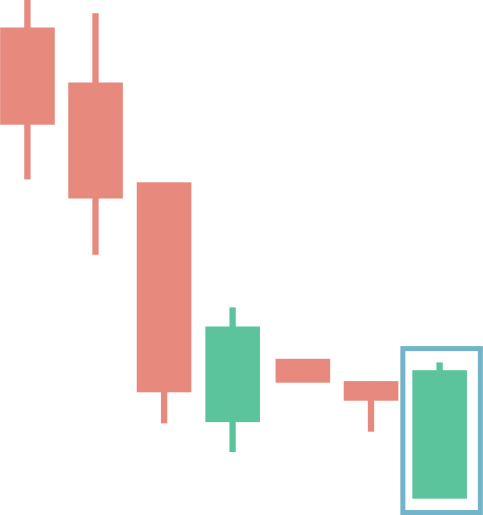
The bullish belt hold is a candlestick pattern signaling a potential reversal from a downtrend, characterized by a long bullish candle that opens below the previous close and closes near its high. It’s most effective near support levels and should be confirmed with additional indicators.
When analyzing candlestick patterns, the bullish belt hold is a single-day Japanese candlestick formation that signals a potential reversal of a prevailing downtrend.
Imagine a period dominated by bearish trades. Suddenly, a bullish or green candlestick appears. You’ll see that the opening price drops below the previous day’s close, setting the low for the day. As the trading day progresses, the cryptocurrency's price rises steadily, culminating in a long white candlestick with a short upper shadow and no lower shadow.
This pattern serves as a counterpart to the bearish belt hold, offering insights into possible market reversals.
Understanding a Bullish Belt Hold
Picture a candlestick that resembles a white Marubozu—it opens at the lowest point of the period and rallies to close near its high, leaving just a small shadow at the top. This is the bullish belt hold, emerging after a series of bearish candlesticks within a downtrend.
Notice how the opening price is significantly lower than the previous day’s low. As the day progresses, the price rises steadily, and the candle closes well into the body of the previous candle, effectively preventing further price drops. This characteristic is why it's called a "belt hold."
Known as yorikiri in Japanese, the bullish belt hold often signals a shift in investor sentiment from bearish to bullish. While this candlestick pattern appears frequently, its ability to predict future price movements can yield mixed results. The effectiveness of the bullish belt hold increases when it forms near a support level, such as a horizontal support, a trend line, a moving average, or key market pivot points.
When analyzing this pattern, it’s important to consider more than just two days of trading data. The bullish belt hold can be identified across all time frames, but it tends to be more reliable on daily and weekly charts where a larger number of traders contribute to its formation.
Trading the Bullish Belt Hold
When you spot a bullish belt hold, it's crucial not to rely on it alone. Incorporate other technical indicators and price patterns to strengthen the validity of the signal.
For example, if the bullish belt hold opens below a previous swing low and then closes above that level, it might form a potential double bottom. Ensure that the bullish belt hold is represented by a long green candlestick, signaling that the bulls have taken control. Ideally, the candle before this pattern should show above-average volume, indicating significant selling pressure and a possible reversal to the upside.
Be aware that the bullish belt hold isn't always reliable and can sometimes fail to predict future price movements accurately. In some cases, it might simply be a temporary pause in an ongoing downtrend. To avoid false signals, wait for the price to confirm the pattern by trading above the high of the belt hold candlestick before entering a trade.
If you prefer a more conservative strategy, wait for the price to close above the high of the pattern. For a long bullish belt hold candlestick, you might place a stop-loss order at its midpoint. Alternatively, setting a stop below the pattern provides a wider stop, reducing the chances of being stopped out by market noise.
Bullish Belt Hold vs. Bearish Belt Hold
When diving into technical analysis, you'll encounter both the bullish belt hold and the bearish belt hold as single candlestick patterns. Understanding the distinction between them is crucial for anticipating future price movements.
The bullish belt hold emerges during a downtrend. It starts with a significant gap down at the open, followed by a long bullish candlestick that opens near the day's low and closes near the high. This pattern signals that buyers are stepping in strongly, pushing the price up and indicating a potential reversal from bearish to bullish sentiment.
Conversely, the bearish belt hold appears during an uptrend. It begins with a significant gap up at the open, followed by a long bearish candlestick that opens near the day's high and closes near the low. This formation suggests that sellers are taking control, driving the price down and potentially reversing the market sentiment from bullish to bearish.
Both patterns gain their significance by often forming at key support or resistance levels. This positioning reinforces their role in signaling potential trend reversals or continuations. However, as with any technical analysis tool, it's essential to consider additional factors such as volume, trend strength, and the overall market conditions before making trading decisions based solely on these patterns.
Strengths of the Bullish Belt Hold Pattern
Trading the bullish belt hold pattern comes with several advantages that can enhance your trading strategy. Here are some of its key strengths:
Clear Signal of Reversal: When you identify a bullish belt hold pattern after a downtrend, it serves as a clear and visually distinct signal that a potential reversal is on the horizon. This pattern indicates that buyers have gained the upper hand, likely driving the price higher from this point forward.
Strong Bullish Momentum: The presence of a long bullish candlestick within the bullish belt hold pattern signifies robust buying pressure and strong bullish momentum. This suggests that buyers are highly motivated and confident in their positions, providing a compelling confirmation of the trend's potential continuation.
Validation from Support Levels: Often, bullish belt hold patterns form near key support levels. When this pattern appears at a support level, it reinforces the likelihood of a trend reversal, acting as additional confirmation that the market sentiment is shifting in favor of buyers.
Defined Risk-Reward Ratio: Utilizing the bullish belt hold pattern allows you to establish clear stop-loss levels based on the low of the bullish candlestick. By placing a stop-loss order below this low, you can effectively define your risk in advance, managing potential losses more efficiently.
Versatility across Timeframes: The bullish belt hold pattern is versatile and can be identified across various timeframes, from intraday charts to daily and weekly charts. This flexibility means you can incorporate the pattern into different trading strategies, whether you’re a day trader seeking short-term gains or an investor aiming for long-term profits.
Advantages of the Bullish Belt Hold Pattern
Using the bullish belt hold pattern in your trading strategy brings several benefits. Here are some of its key advantages:
Clear Reversal Indicator: When you identify a bullish belt hold pattern after a downtrend, it serves as a distinct and easily recognizable sign of a potential trend reversal. This pattern indicates that buyers have taken control, likely driving the price higher from this point onward.
Strong Bullish Momentum: The long bullish candlestick within the bullish belt hold pattern highlights significant buying pressure and strong bullish momentum. This suggests that buyers are highly motivated and confident in their positions, providing a solid confirmation of the trend's potential continuation.
Support Level Confirmation: Bullish belt hold patterns frequently form near key support levels. When this pattern appears at a support level, it strengthens the likelihood of a trend reversal, acting as additional confirmation that the market sentiment is shifting in favor of buyers.
Defined Risk-Reward Parameters: Trading the bullish belt hold pattern allows you to set clear stop-loss levels based on the low of the bullish candlestick. By placing a stop-loss order below this low, you can effectively manage and define your risk in advance.
Flexibility Across Timeframes: The bullish belt hold pattern is versatile and can be identified across various timeframes, from intraday charts to daily and weekly charts. This flexibility enables you to incorporate the pattern into different trading strategies, whether you're aiming for short-term gains as a day trader or seeking long-term profits as an investor.
Alternatives to the Bullish Belt Hold Pattern
While the bullish belt hold pattern can be a valuable tool in your trading arsenal, exploring alternative methods can enhance your strategy. Here are some common alternatives you might consider:
Other Candlestick Patterns: Diversify your analysis by incorporating different candlestick patterns that signal potential trend reversals or continuations. Patterns such as the hammer, bullish and bearish engulfing patterns, morning star, and evening star can provide additional insights into market movements.
Technical Indicators: Utilize technical indicators to identify trend reversals or to confirm existing signals. Popular indicators include moving averages, the Relative Strength Index (RSI), the stochastic oscillator, MACD (Moving Average Convergence Divergence), and Bollinger Bands. These tools can help you gauge market momentum and strength.
Support and Resistance Levels: Analyze support and resistance levels on your price charts to pinpoint areas where buying or selling pressure may emerge. Watching for breakouts above resistance or bounces off support can indicate potential trend changes or continuations. Tools like trendlines, Fibonacci retracement levels, pivot points, and horizontal price levels can help you identify these critical zones.
Price Patterns: Expand your chart analysis beyond candlestick patterns by looking for other price patterns such as triangles, flags, pennants, and head and shoulders formations. These patterns can offer valuable insights into market consolidation, trend continuations, or possible reversals, enhancing your ability to make informed trading decisions.
Volatility’s Effect on Bullish Belt Holds
Market volatility plays a significant role in the effectiveness of bullish belt hold patterns. When volatility is high, price fluctuations and erratic movements become more frequent, making it harder to accurately interpret the pattern. What might initially appear as a bullish formation could actually be a result of a volatile market with rapid price changes.
In environments with high volatility, price gaps occur more often. Additionally, volatility can influence the size and duration of price movements following a bullish belt hold pattern. While the pattern typically indicates a potential reversal of a downtrend and the onset of an uptrend, its reliability may decrease as price movements can become exaggerated or short-lived.
Trading in volatile conditions requires adjustments to your strategy. Consider using wider stop-loss orders, reducing position sizes, or adopting more conservative trading approaches. In such scenarios, obtaining confirmation from other technical indicators becomes even more crucial to ensure the validity of the bullish belt hold signal.
Limitations of Trading with Bullish Belt Holds
While the bullish belt hold pattern can enhance your trading strategy, it's essential to be aware of its limitations. One major concern is the potential for false signals, particularly in choppy or highly volatile market conditions. In such environments, what seems like a bullish belt hold might just be the result of erratic price movements rather than a true trend reversal.
Another limitation is the necessity for confirmation from other technical indicators or analysis techniques. Relying solely on the bullish belt hold pattern can increase the risk of making inaccurate trading decisions. To improve the reliability of your trades, integrate additional tools such as moving averages, Relative Strength Index (RSI), or support and resistance levels. These confirmations help validate the signals from the bullish belt hold, reducing the chances of acting on misleading patterns.
The Bottom Line
The bullish belt hold pattern can be a valuable tool for identifying potential reversals in a downtrend, signaling a shift in market sentiment toward the bullish side. However, its reliability increases when combined with other technical indicators and market conditions.
While it provides clear entry and risk management points, traders should remain cautious of false signals, particularly in volatile markets, and seek confirmation before making decisions.
By understanding both its strengths and limitations, traders can effectively incorporate the bullish belt hold into their strategies to better navigate market reversals.


_webp.webp&w=3840&q=75)
_webp.webp&w=3840&q=75)


