The Dragonfly Doji candlestick, showing identical open, high, and close prices with a long lower shadow, suggests potential market reversals. Traders can use this candlestick pattern to buy a cryptocurrency at a great price.
Understanding the Dragonfly Doji Candlestick
A Dragonfly Doji is a unique candlestick pattern that can indicate a potential reversal in price direction, either to the downside or upside, depending on prior price movements. This pattern forms when an asset's high, open, and close prices are identical.
The defining feature of the Dragonfly Doji is its long lower shadow, which reveals that there was significant selling pressure during the period. However, the fact that the price closed near the open indicates that buyers stepped in, absorbed the selling pressure, and pushed the price back up, signaling a potential shift in market sentiment.
Following a Downtrend
When a Dragonfly Doji appears after a downtrend, it suggests that a price rise might be on the horizon. The long lower shadow indicates that sellers dominated early on, but by the end of the session, buyers had managed to push the price back to the open.
This action signals increased buying pressure and a possible upward reversal. For confirmation, the next candle should rise and close above the Dragonfly Doji’s close. A strong rally on this confirmation day strengthens the reliability of the reversal signal.
Following an Uptrend
Conversely, when a Dragonfly Doji appears after an uptrend, it can indicate that selling pressure is entering the market and a price decline might follow. The long lower shadow shows that sellers were able to exert significant pressure, even though the price closed unchanged.
For the bearish reversal to be confirmed, the next candle must drop and close below the Dragonfly Doji’s close. If the price rises instead, the reversal signal is invalidated, suggesting the uptrend may continue.
Trading the Dragonfly Doji
Traders often enter positions based on the confirmation candle:
Bullish Reversal: Enter long positions if the next candle rises and closes above the Dragonfly Doji’s close, placing a stop loss below the Dragonfly’s low.
Bearish Reversal: Enter short positions if the next candle falls and closes below the Dragonfly Doji’s close, placing a stop loss above the Dragonfly’s high.
Enhancing Reliability
The Dragonfly Doji is more reliable when used with other technical indicators. High volume during the Dragonfly Doji formation generally strengthens the signal. Additionally, a strong price move and volume on the confirmation candle enhance its reliability. It's also beneficial to consider the broader chart pattern context, such as the Dragonfly Doji appearing at the end of a head and shoulders pattern, to reinforce the signal.
Example of How to Use the Dragonfly Doji
Dragonfly dojis is rare, because it is uncommon for the open, high, and close all to be exactly the same. There are usually slight discrepancies between these three prices. The example below shows a dragonfly doji that occurred during a downturn correction in a major bear market. The dragonfly doji moves below the recent lows but then is quickly swept higher by the buyers.
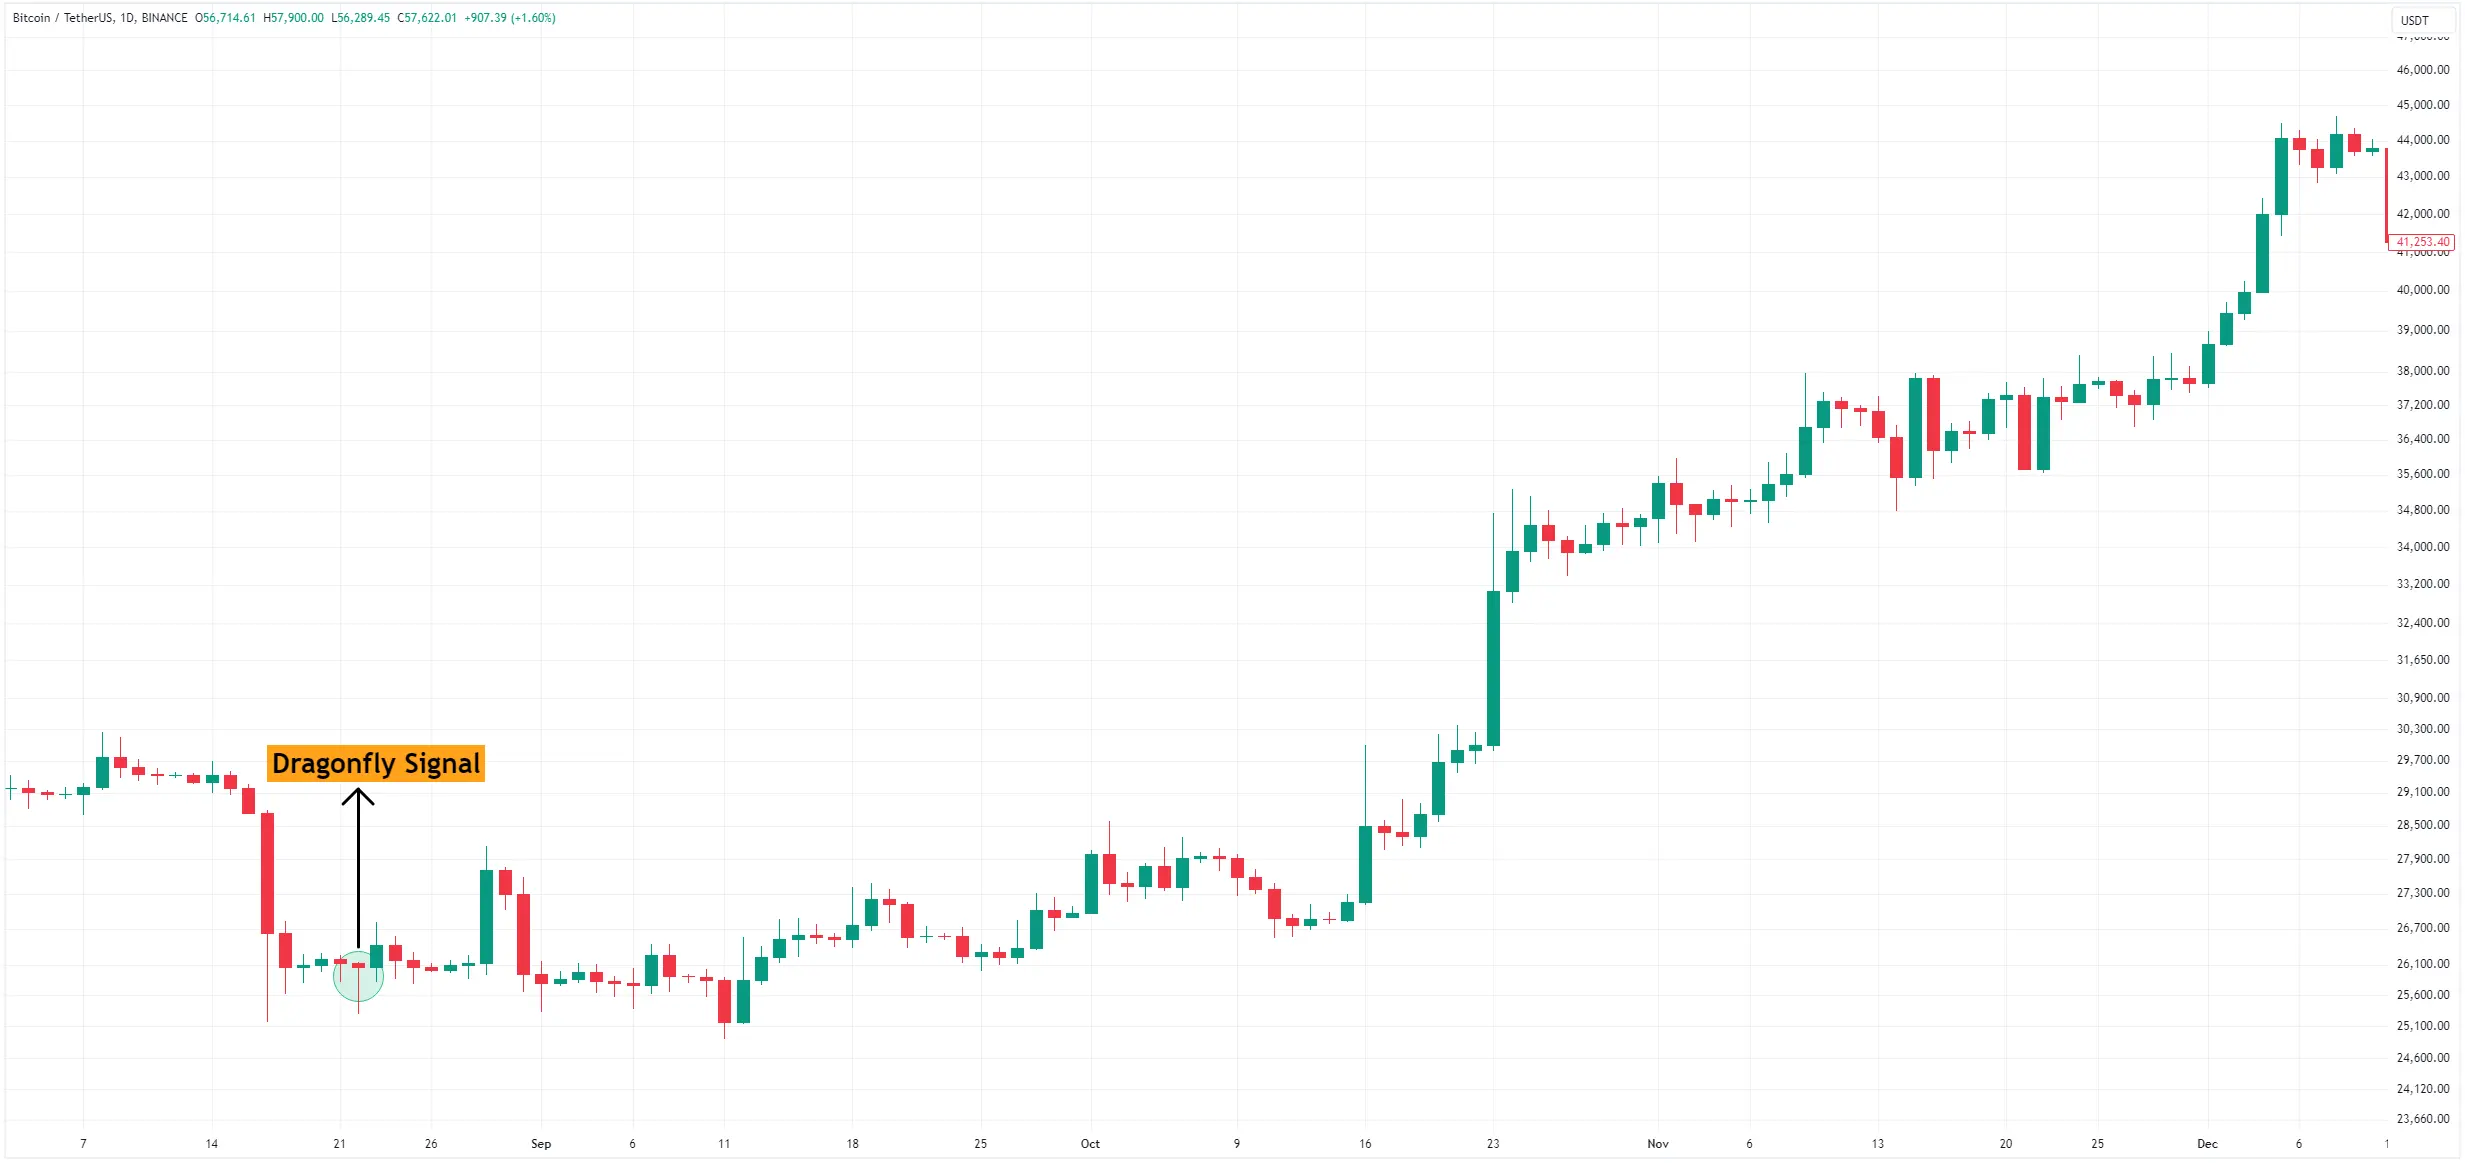
Following the dragonfly, the price proceeds higher on the following candle, confirming the price is moving back to the upside. Traders would buy during or shortly after the confirmation candle. A stop-loss can be placed some place below the low of the dragonfly.
The dragonfly candle has therefore worked as a trend reversal, where Bitcoin’s price reversed and headed higher instead of continuing its downturn.
Dragonfly Doji Limitations
The Dragonfly Doji, while a fascinating candlestick pattern, has its limitations and should be approached with caution in trading.
Rarity and Reliability: The Dragonfly Doji is not a common pattern and even when it appears, it’s not always a reliable indicator of price reversals. There’s no guarantee that the price will move in the expected direction following the confirmation candle.
Trade Entry and Stop Loss Challenges: The size of the Dragonfly Doji and its confirmation candle can sometimes result in an entry point that is far from the optimal stop loss location. This distance can create a risk/reward ratio that is not favorable. Traders might need to find an alternative stop loss placement or even forgo the trade if the risk appears too high.
Lack of Price Targets: Estimating the potential reward of a trade based on the Dragonfly Doji can be challenging. Candlestick patterns typically don’t provide specific price targets. Traders need to use additional techniques, such as other candlestick patterns, indicators, or strategies, to determine when to exit a trade profitably.
Learning more about the Dragonfly Doji
What Is the Dragonfly Doji Used For?
The Dragonfly Doji is a candlestick pattern used to identify potential reversals in the market. It forms when the open and close prices of an asset are nearly identical, indicating a potential shift in market direction.
Difference Between a Doji and a Spinning Top
While both Doji and Spinning Tops indicate indecision in the market, they differ in their structure:
Doji: The real body is very small, typically making up only about 5% of the candle’s entire range.
Spinning Top: Has a larger body compared to a Doji, indicating slightly more movement between the open and close prices.
Difference Between a Dragonfly Doji and a Hammer
Both the Dragonfly Doji and the Hammer signal bullish reversals at the bottom of downtrends, but their structures differ:
Dragonfly Doji: The open and close prices are at the same level, forming a T-shape with a long lower shadow.
**Hammer:**Has a small body at the top of the trading range with the open and close prices slightly different, also featuring a long lower shadow.
For best results, both patterns should be used alongside other technical indicators.
The Bottom Line
A Dragonfly Doji is a candlestick pattern that can signal a potential price reversal, either up or down, depending on prior price movements. This pattern forms when the high, open, and close prices of an asset are identical. The long lower shadow indicates significant selling pressure during the period, but the close near the open price shows that buyers managed to absorb this selling and push the price back up.
The Dragonfly Doji is particularly noteworthy when it appears after a price decline, suggesting a potential upward reversal. Conversely, if it forms after a price advance, it may indicate increased selling pressure and a possible price drop.
However, for the pattern to be reliable, it must be confirmed by the candle that follows the Dragonfly Doji. This confirmation candle can help validate the anticipated direction of the price movement.

_webp.webp&w=1920&q=75)
_webp.webp&w=1920&q=75)