.webp&w=3840&q=75)
What Is RSI Bullish and Bearish Divergence In Crypto?
RSI divergence indicates potential Bitcoin price trends: bullish divergence signals a strengthening market despite falling prices, while bearish divergence warns of possible reversals despite rising prices. Analyzing these patterns can help you become a better trader!
Understanding Bitcoin Price Divergence
Everyone in the crypto world is eager to know the next move for Bitcoin's price. While predicting future price movements with certainty is impossible, price divergence can offer some clues.
Divergence happens when Bitcoin’s price creates higher highs, but the Relative Strength Index (RSI) or any other oscillator you are using shows lower lows, or vice versa. Essentially, divergence occurs when the direction of the price conflicts with the direction indicated by technical indicators, leading to a noticeable pattern of disagreement.
Identifying Bullish Divergence in Bitcoin
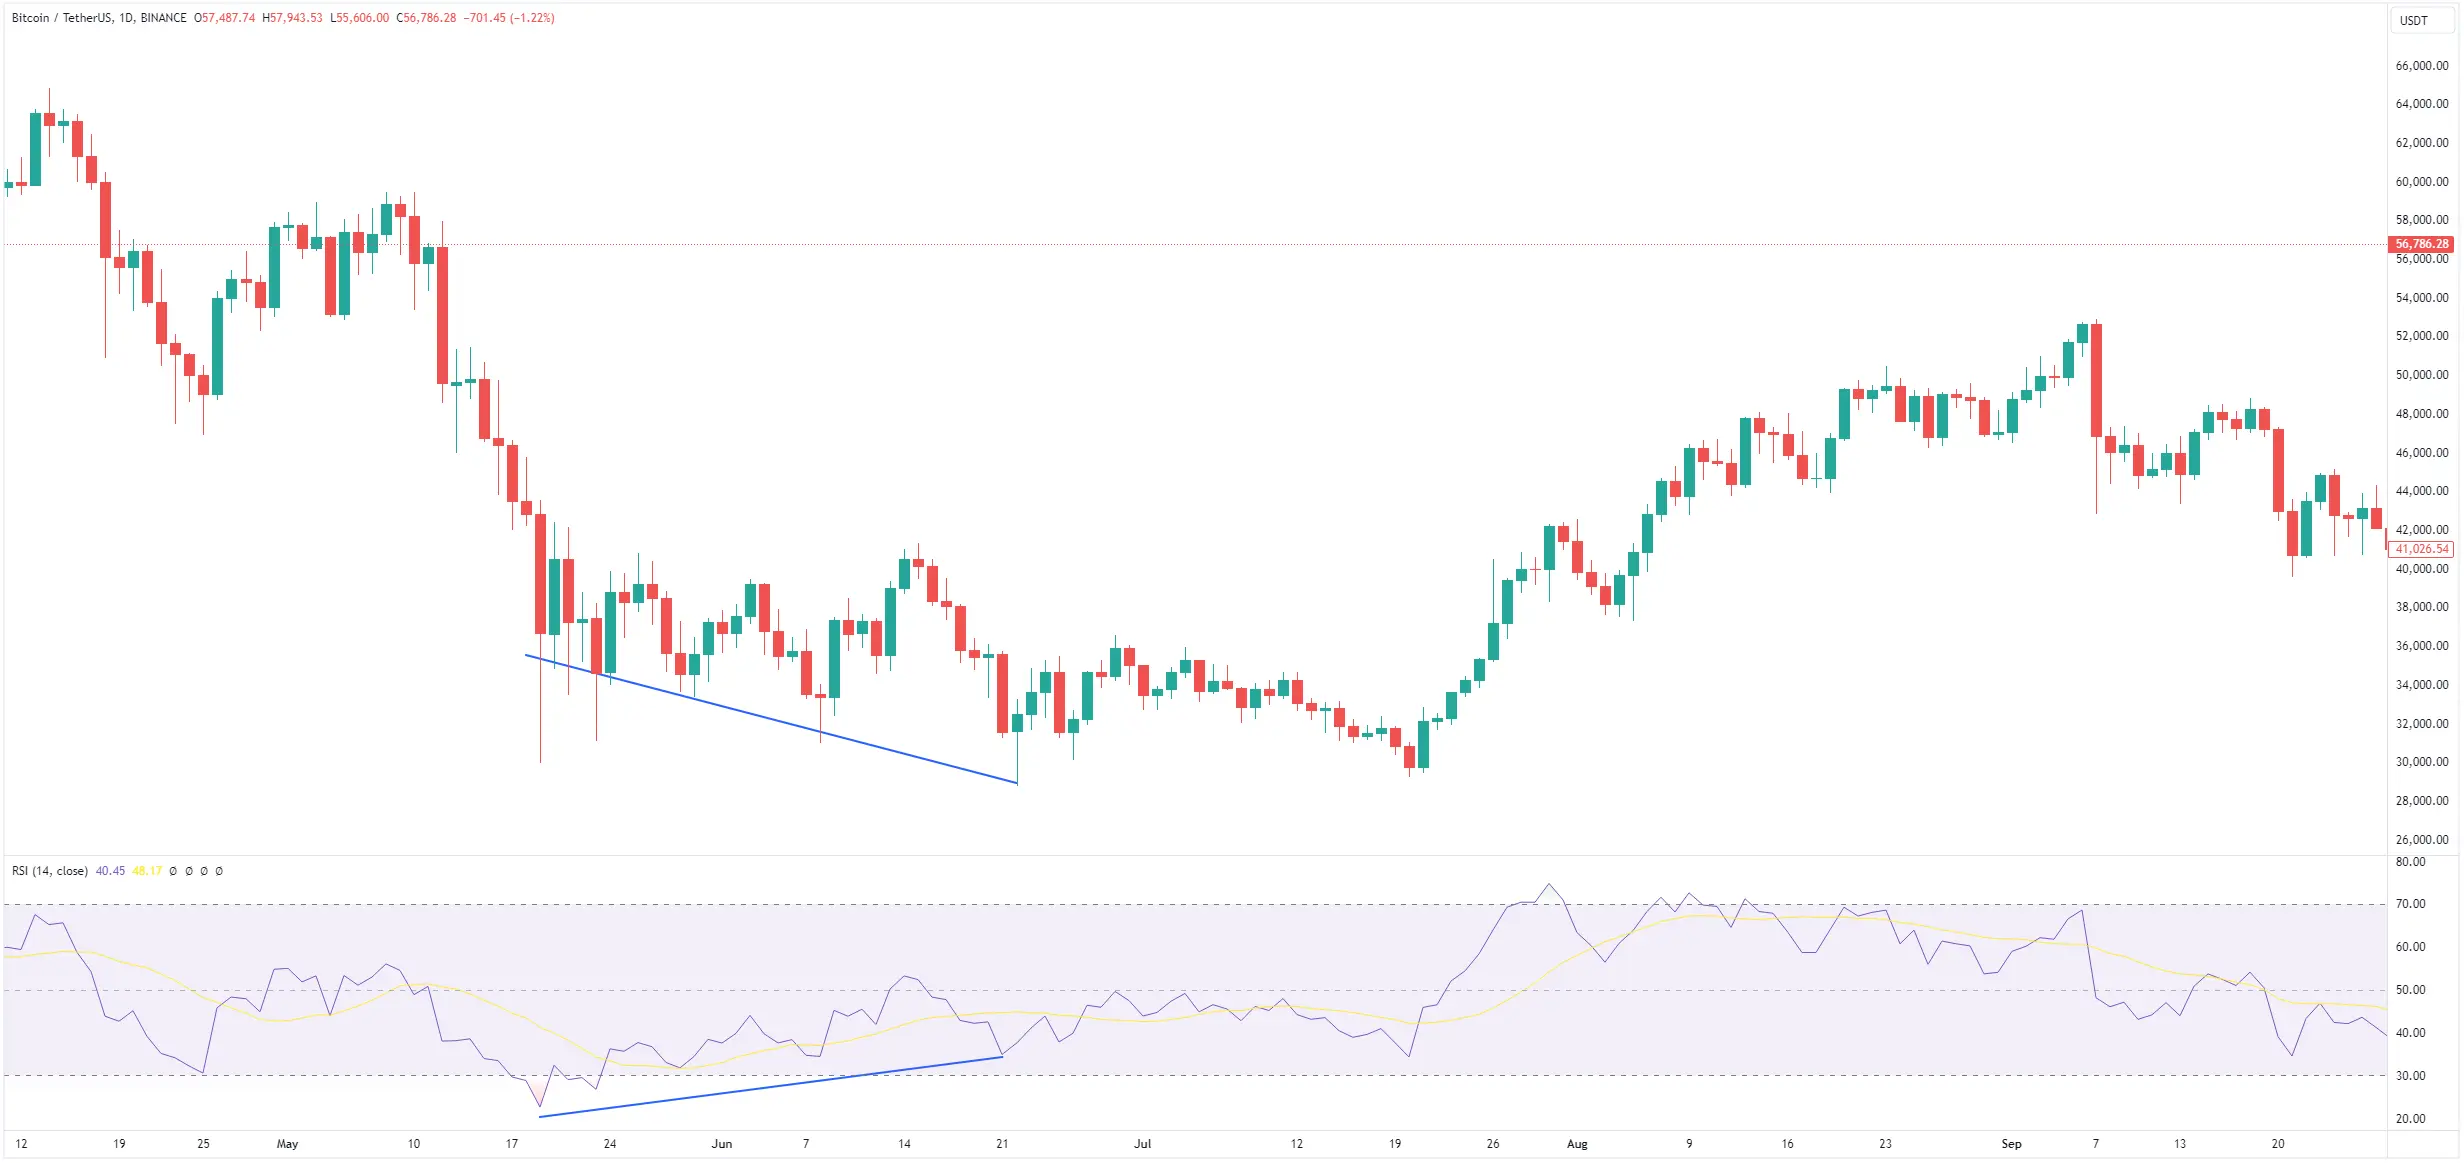
The Bitcoin daily chart illustrates a bullish divergence between the price action and the Relative Strength Index (RSI, shown as the purple line). Here, the price is in a clear downward trend, while the RSI is trending upwards. This discrepancy suggests that even though the price is falling, market sentiment is strengthening.
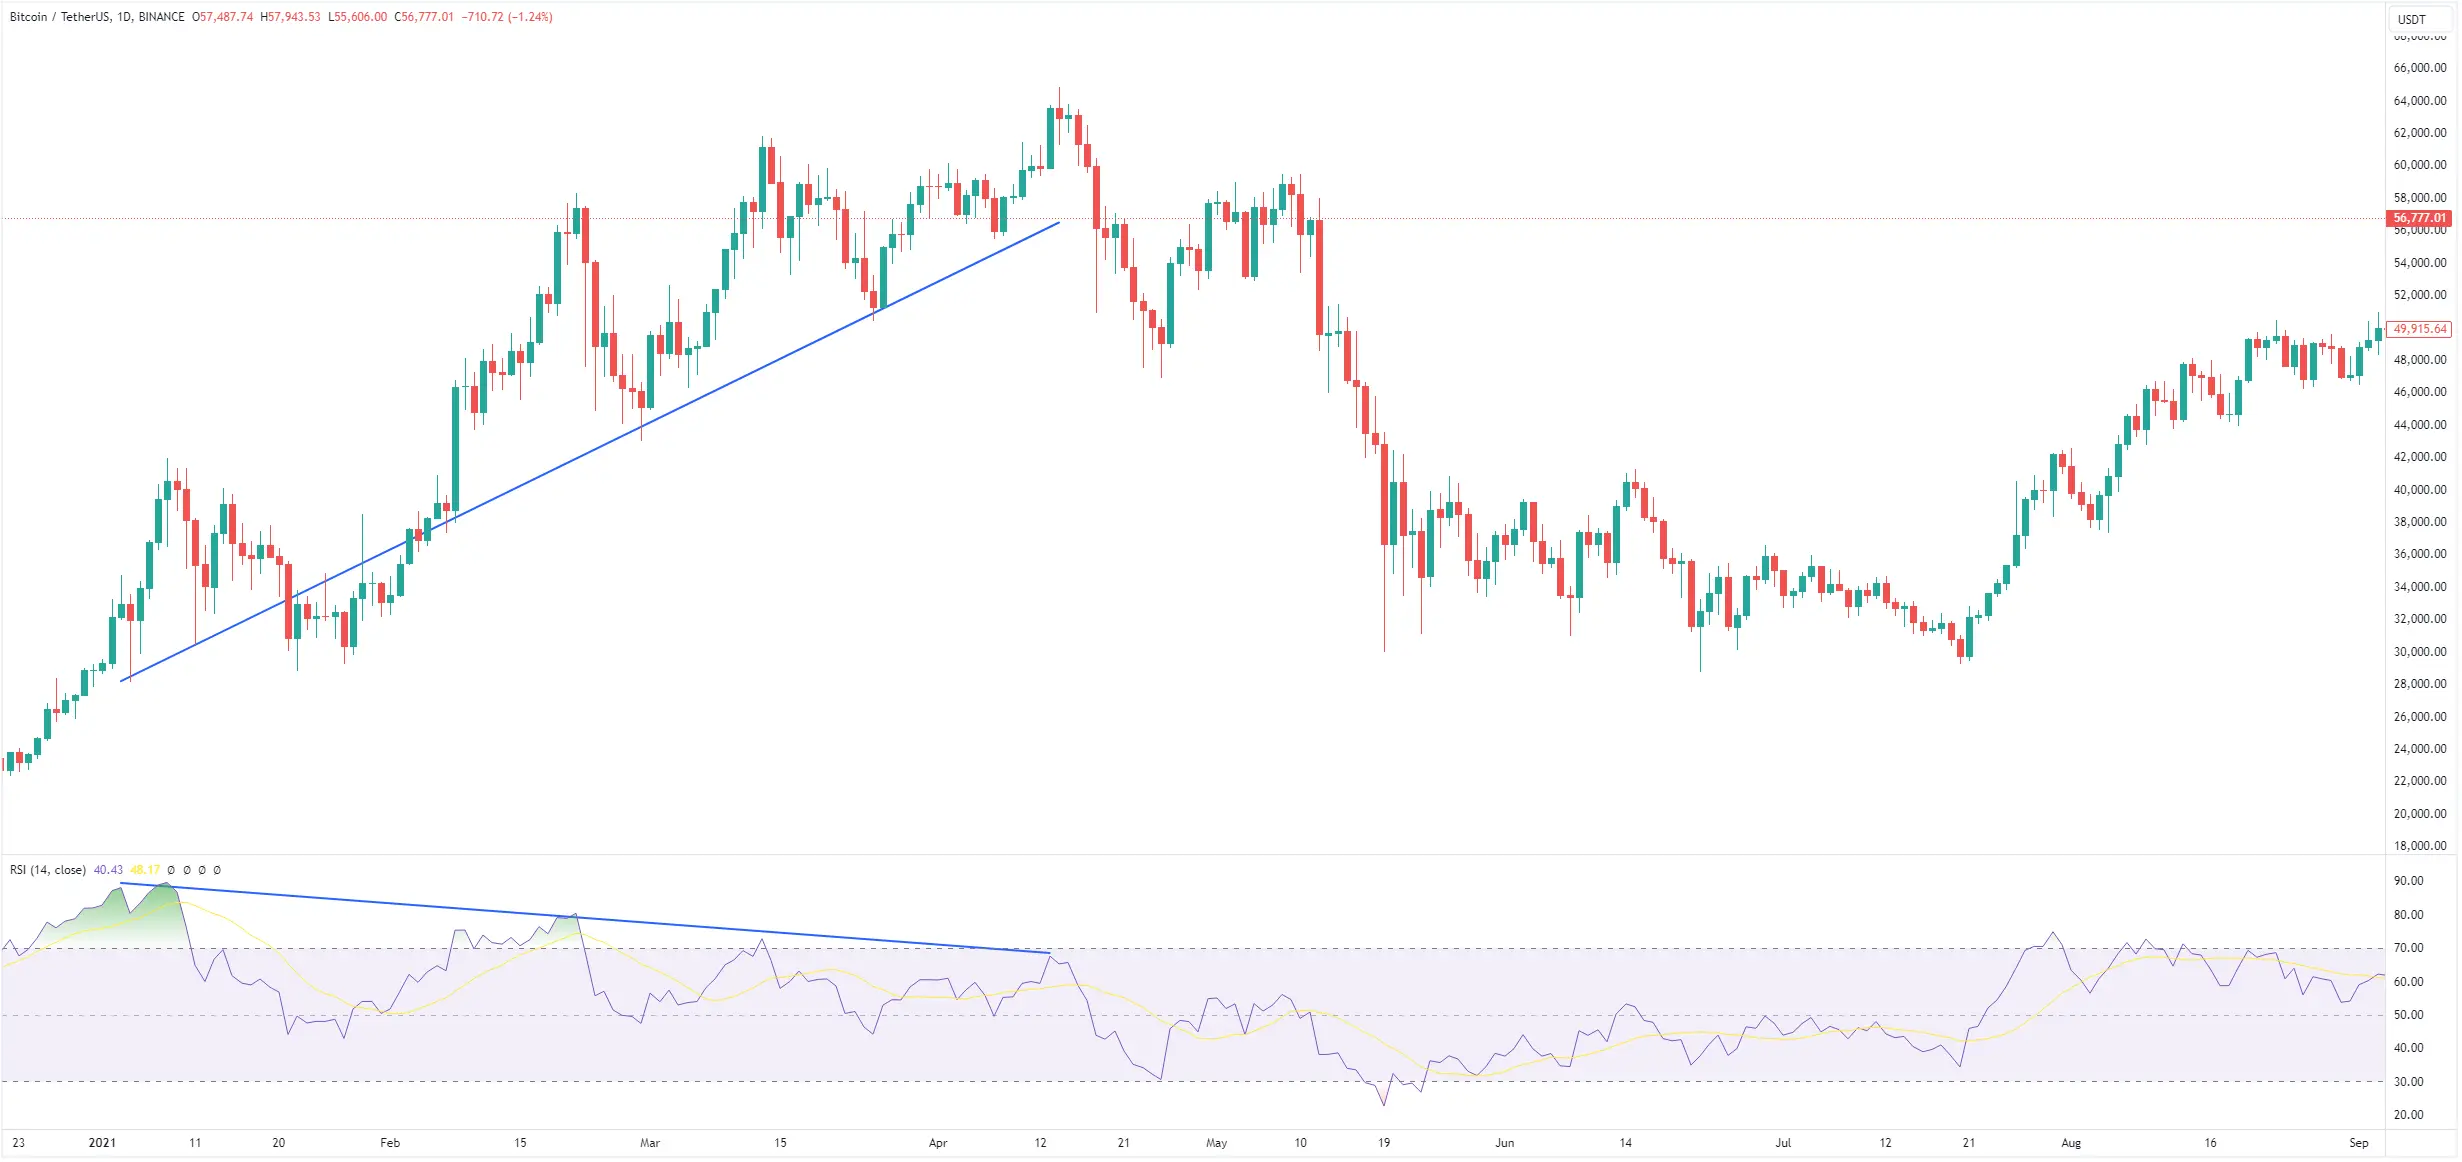
This concept also works oppositely, as seen in another daily Bitcoin chart example above. A definite bearish divergence was seen during Bitcoin’s climb to break new all-time high prices twice: Nov-Dec 2017, when BTC climbed towards $20K and lost over 80% in 12 months, and also during the April 2021 climb towards $65K, when the cryptocurrency lost 50% shortly afterwards.
In both cases, as the price climbed toward its peak, the RSI posted a downward pattern, indicating a market reversal – or bearish divergence.
Understanding Divergence Across Time Frames
When analyzing chart patterns, it's essential to consider the time frames. Divergences can appear on various time frames, including short-term charts like the 15-minute chart. However, higher time frames often carry more significance and impact. Focusing solely on short-term divergences might cause you to overlook broader trends.
However, if you are interested in day trading, then looking at the 15 minutes timeframe in order to make a trade can work well.
Hidden Divergence
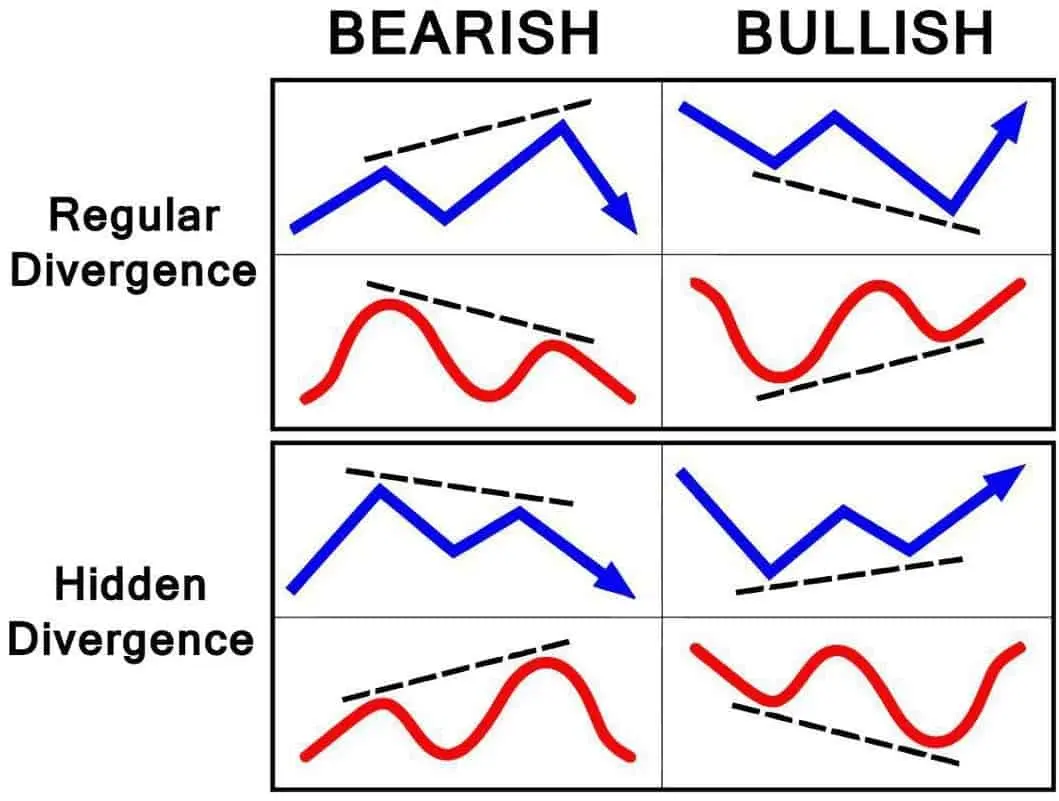
Hidden divergence is another key concept to understand. Unlike regular divergence, which signals potential trend reversals, hidden divergence indicates the continuation of an existing trend.
Refer to the divergence cheat sheet for clarity. Bullish hidden divergence occurs when the price makes lower lows while the indicator forms higher lows. Conversely, bearish hidden divergence is seen when the price makes higher highs, and the indicator shows lower highs.
Avoid Relying on Divergence Alone
Divergence shouldn't be your sole tool when analyzing Bitcoin or other cryptocurrencies. It’s crucial to combine it with other factors, such as support and resistance levels or moving averages.
In technical analysis, especially in the crypto market, confluence is key. Relying on just one indicator or viewpoint can be misleading. Integrating multiple methods often provides a clearer picture.
Remember, no analysis method offers guarantees. Price movements can be unpredictable, even with strong confluence signals from larger time frames. Even well-established patterns can deviate from expectations.
Bottom Line
RSI bullish and bearish divergence can provide valuable insights into Bitcoin's price movements. Bullish divergence, where the RSI trends up while the price declines, may signal strengthening market sentiment. Conversely, bearish divergence, where the RSI falls despite rising prices, can indicate potential reversals.
It’s essential to analyze divergences across different time frames, with higher time frames often offering more reliable signals. Additionally, understanding hidden divergence, which suggests trend continuation, can further refine your analysis.
However, divergence should not be used in isolation. Combining it with other technical indicators, such as support and resistance levels, offers a more comprehensive view. Always remember that no analysis method guarantees accuracy in the volatile crypto market, so a multi-faceted approach is key to effective decision-making.


_webp.webp&w=3840&q=75)
_webp.webp&w=3840&q=75)


