
Understanding the Inverted Hammer Candlestick Pattern in Technical Analysis
The Inverted Hammer candlestick signals potential bullish reversals post-downtrend, notable for its small body and long upper shadow. Let's learn more about its formation, implications, and strategic trading approaches.
In this guide, we’ll delve into the Inverted Hammer Candlestick Pattern, exploring its visual characteristics, dissecting its components, demonstrating interpretation through an example, and outlining practical trading strategies.
What Exactly is the Inverted Hammer Candlestick?
The Inverted Hammer candlestick typically appears at the end of a downtrend and often signals a potential reversal towards bullish momentum.
The crucial insight for traders lies in observing the subsequent day's price action following the appearance of the Inverted Hammer pattern. This observation can provide valuable clues about the likely direction of future price movements.
What Does the Inverted Hammer Candlestick Pattern Look Like?
The Inverted Hammer takes shape when the opening, low, and closing prices align closely, forming a small real body. It's characterized by a significant upper shadow that extends at least twice the length of the real body.
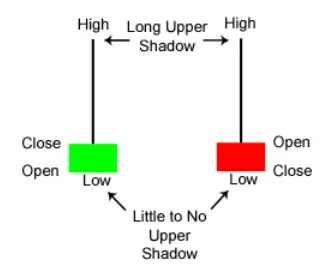
Differentiating Between Green and Red Inverted Hammer Candlesticks
When the opening price matches the low, it forms a bullish green Inverted Hammer candlestick, which is generally seen as a stronger signal of potential bullish reversal compared to a red Inverted Hammer where the low matches the closing price.
How to Trade Using an Inverted Hammer Candlestick
It's crucial to understand that while the Inverted Hammer pattern indicates a potential price reversal, it alone is not a buy signal. Traders should look for additional confirming factors such as a breakout of a trendline or a follow-up confirmation candle to strengthen the buy signal.
This approach helps in making more informed trading decisions based on the broader context of market indicators.
Is the Inverted Hammer Candlestick Bullish or Bearish?
In technical analysis, the Inverted Hammer candlestick pattern typically emerges after a prolonged downtrend. Its bullish implication arises from the fact that despite initial downward pressure, prices rebounded to near the opening level by the session's close. This upward movement signals a potential shift in momentum, as buyers challenge the dominance of sellers in the market.
Bottom Line
The Inverted Hammer Candlestick Pattern is a critical tool in technical analysis, signaling potential bullish reversals at the end of downtrends. Recognizable by its small real body and long upper shadow, the pattern's strength varies based on whether the candlestick is green or red.
While a green Inverted Hammer generally suggests a stronger bullish signal, you must look beyond the pattern itself. Confirming factors such as subsequent price action or trendline breakouts are essential for making well-informed trading decisions.
By understanding and correctly interpreting the Inverted Hammer, you can better anticipate market shifts and adjust your strategies accordingly.


_webp.webp&w=3840&q=75)
_webp.webp&w=3840&q=75)


