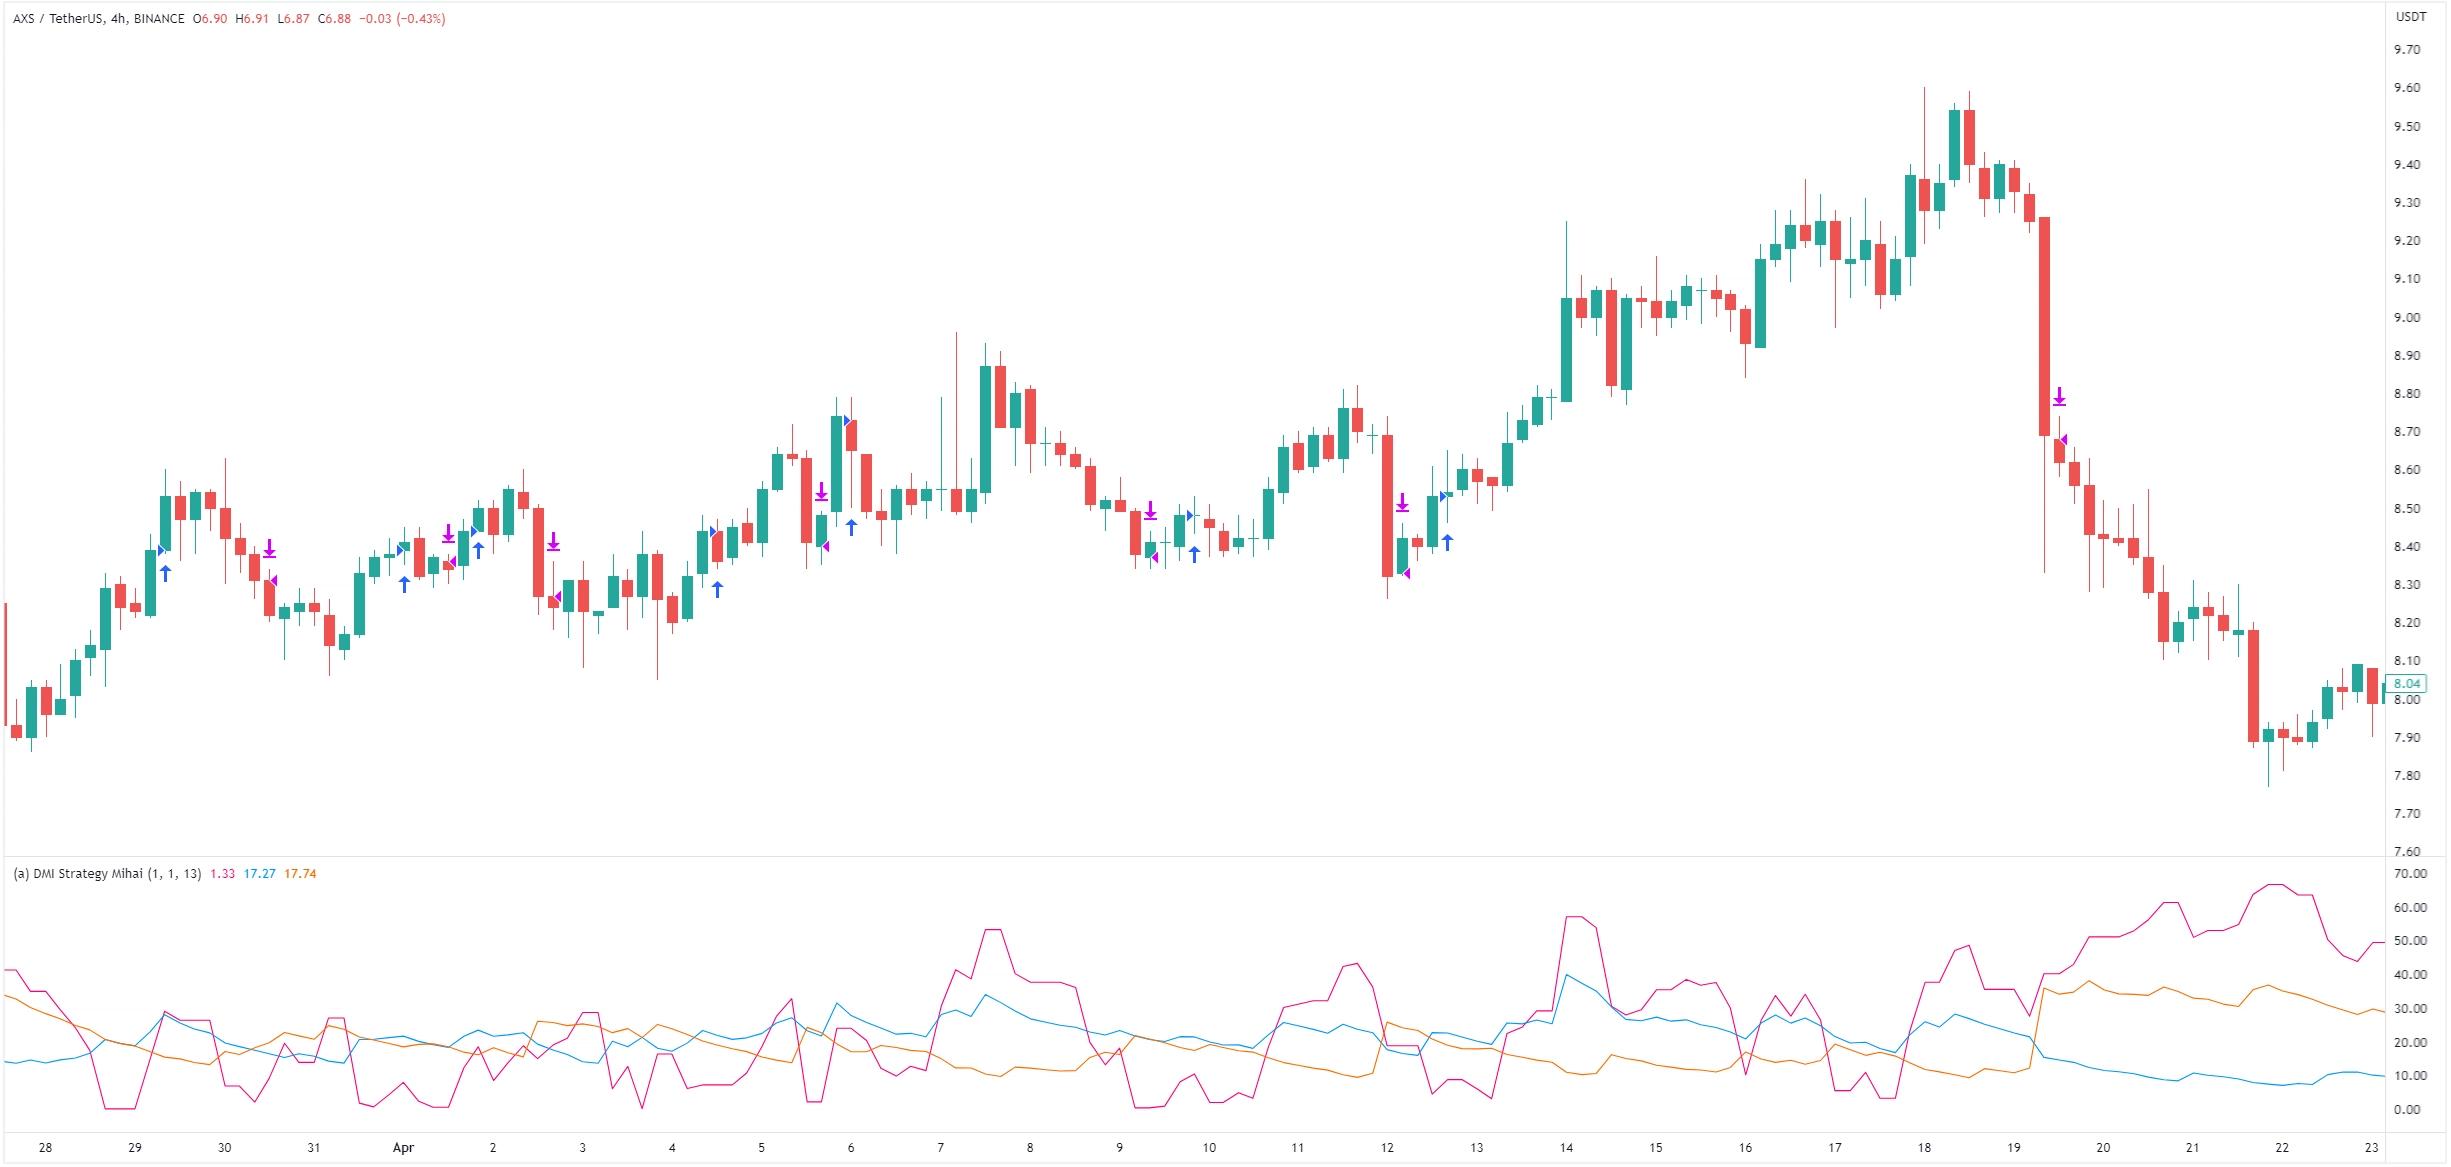
Crypto Trading 101: Beating Axie Infinity With the Directional Movement Index
Let's see how we can beat the market trading Axie Infinity (AXS) with the DMI indicator!
You can now download this strategy for free on Cryptohopper.
Trading with the DMI
The Directional Movement Index ( DMI) was created by J. Welles Wilder and consists of two lines: positive and negative directional movement.
These lines measure the strength of positive and negative trends in the market. When the positive line is above the negative line, it indicates stronger bullish pressure, while the opposite suggests bearish dominance.
The DMI generates buy signals when the positive line crosses above the negative line and sell signals when the positive line crosses below the negative line. These signals occur at the crossover points, as the DMI uses non-sticking signals.
Best DMI strategy for AXS

We have tested different settings to showcase you which ones would have worked the best so far for DMI, to help you on your trading journey. However, you should always do your own research, as what works well now, may not work well in the future anymore.
In our strategy backtest from 2020-11-04 to 2023-05-15, we found that the following settings for the DMI worked best for trading AXS:
Chart period: 4 hours
Period: 137
These settings would have brought returns of 11,499%, which is significantly more than the buy-and-hold strategy’s 1,926% returns. Additionally, the maximum drawdown for this strategy would have been 74% compared to the buy-and-hold strategy's 97% drawdown.
Disclaimer: Past performance does not guarantee future success, as the way the market fluctuates can change at any time. Therefore, please do not trust this setup blindly.

