Celestia (TIA) hit a new all-time high at $16.88, raising speculation about a $20 target. Bullish sentiment is driven by indicators like Elliott Wave theory and RSI. The initial target is $22.80, with potential to reach $31. Monitoring TIA's performance is key; a drop below $14.60 may signal a bearish trend.
Celestia (TIA) has recently achieved a significant milestone by reaching a new all-time high of $16.88, following a flash crash on January 3. This surge in price has prompted discussions about the potential for TIA to reach the $20 mark.
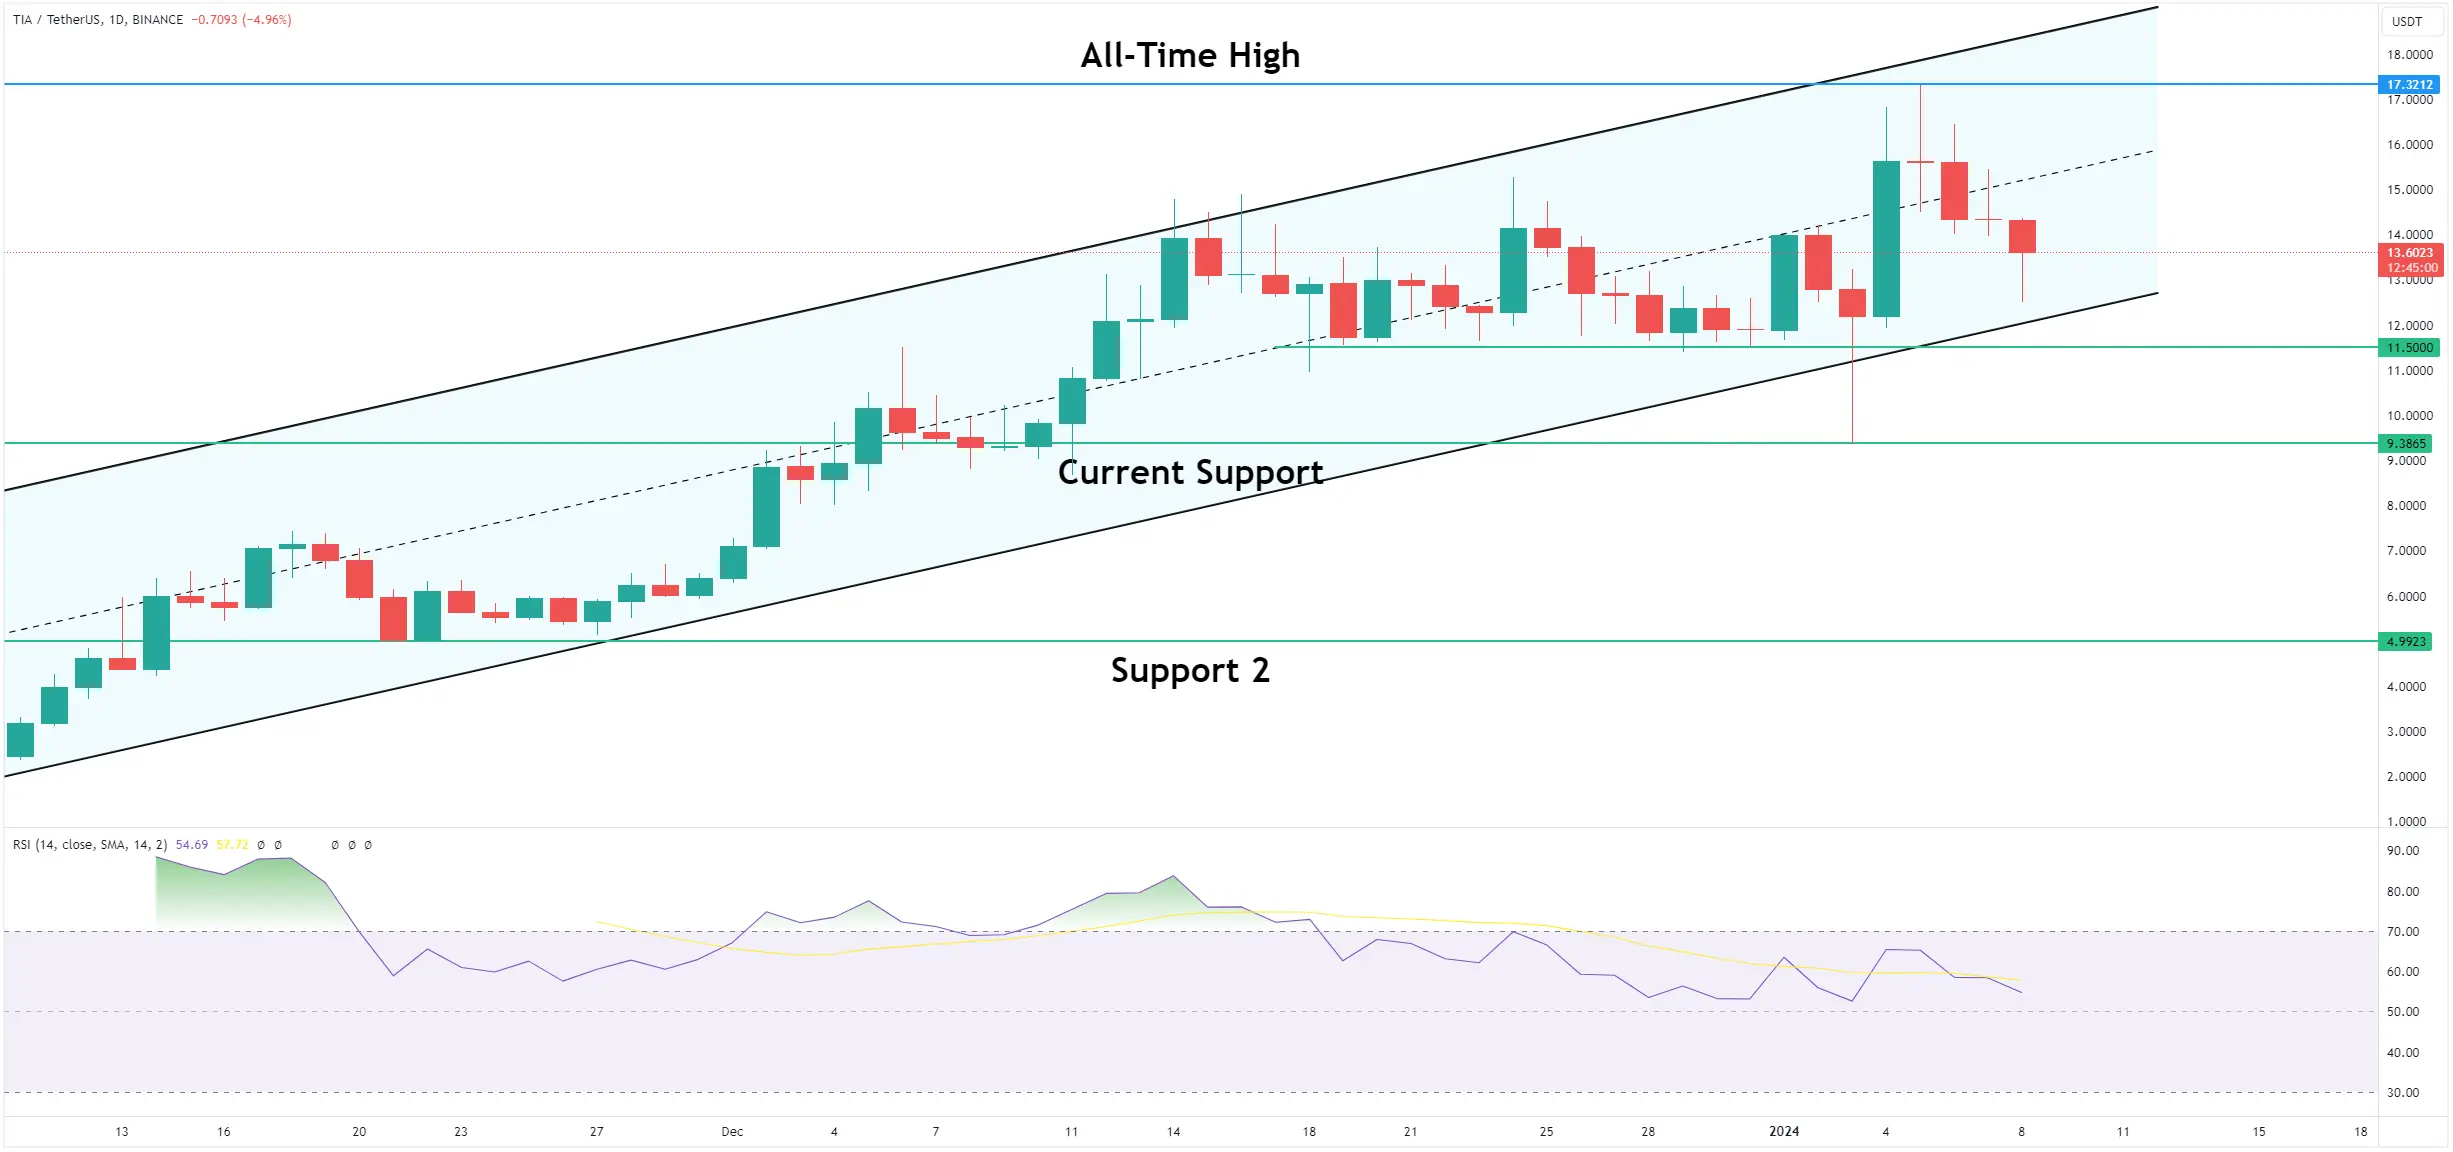
Chart by TradingView
TIA had been following an ascending parallel channel since November, with its resistance and support trend lines frequently validated.
However, on December 16, TIA faced rejection at the channel's resistance trend line, leading to a downward movement and a breakdown from the channel on December 25.
On January 3, TIA experienced a low point at $9.36. Since then, the price has rebounded sharply, reclaiming the channel's support trend line and ultimately reaching a new all-time high.
Bullish Sentiment and Analysis
Market analysts and cryptocurrency traders have expressed bullish sentiment regarding TIA's future prospects, particularly highlighting its impressive recovery following the January 3 low. Some consider TIA as one of the most promising coins at present, while others suggest a shift of interest from SEI to TIA.
Elliott Wave theory, which involves analyzing long-term price patterns and investor psychology, indicates that TIA may have entered a wave three within a five-wave upward movement. The Relative Strength Index (RSI), a momentum indicator, further supports this bullish trend by showing readings above 50 and generating hidden bullish divergence.
Price Predictions
If the upward momentum persists, the initial target for TIA's peak is set at $22.80, representing a 73% increase from the current price. In an extended scenario, TIA could potentially surge by 133% to reach $31.
Despite these bullish predictions, it's essential to monitor TIA's performance closely. A close below the $14.60 support level could signal a bearish trend, possibly resulting in a 40% drop to the nearest support at $9.40.
Bottom Line: Celestia (TIA) has demonstrated remarkable resilience and achieved a new all-time high, sparking optimism about its future price potential.
Start automated trading on Cryptohopper today and enjoy a 3-day free trial!

_webp.webp)
_webp.webp)